You can view explainability forecast results on a model board page.
To set up board pages for explainability forecast results, see:
Examples of explainability forecast results on board pages
![Item level explainability and feature contributions show in a horizontal bar chart.](https://assets-us-01.kc-usercontent.com:443/cddce937-cf5a-003a-bfad-78b8fc29ea3f/8b4ab44d-7ec3-4aac-b02c-4018b293c3f2/MVLR-item-level-contributions.png)
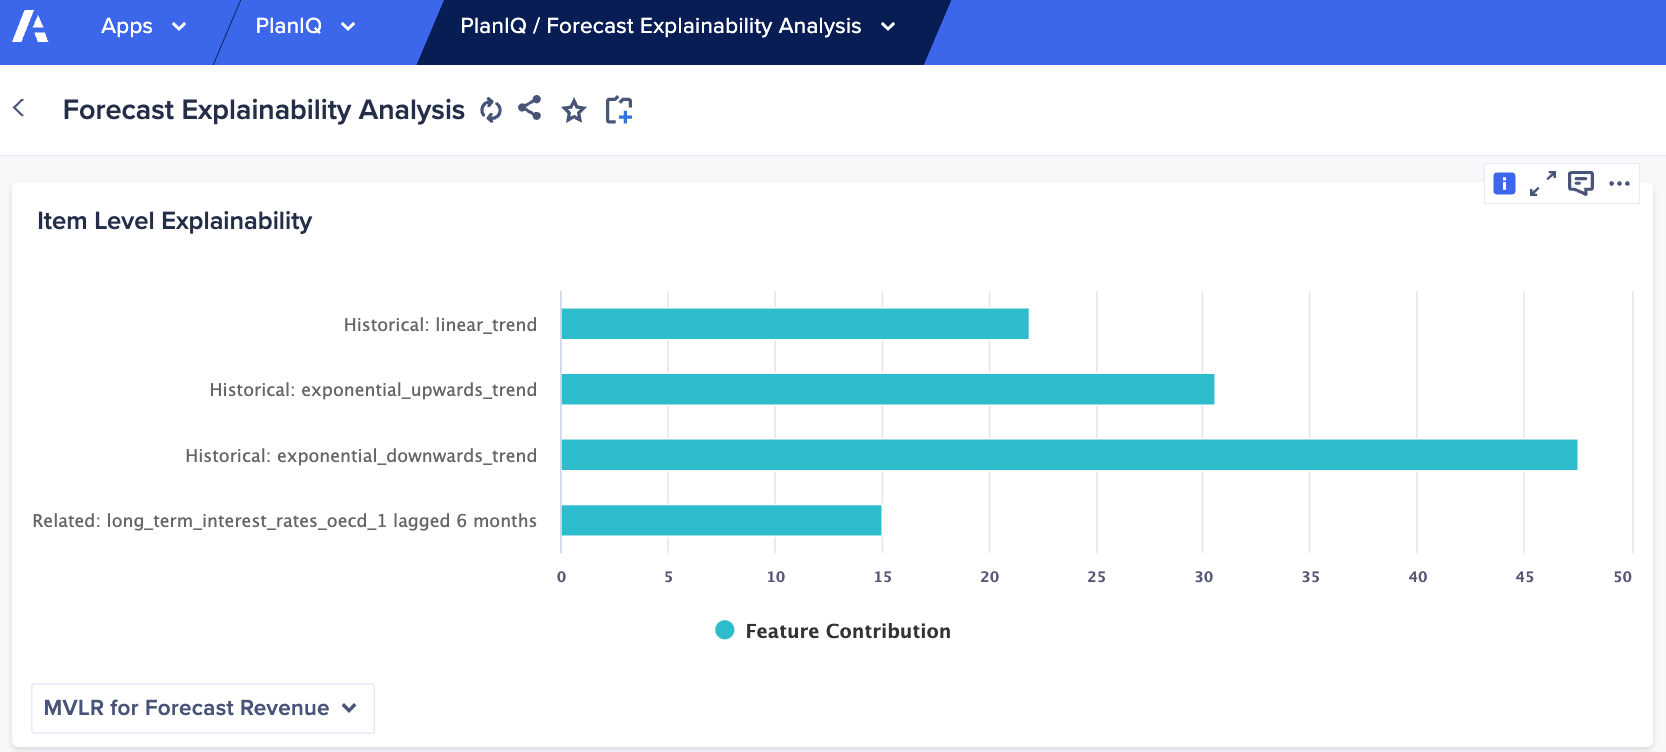
The bar chart above displays Item level explainability and feature contributions.
![Forecast results that include the ability to refresh the MVLR or Amazon Ensemble results.](https://assets-us-01.kc-usercontent.com:443/cddce937-cf5a-003a-bfad-78b8fc29ea3f/2772315d-2cbc-4ff9-b778-5d1fe3fbc87b/PlanIQ-forecast-results.png)
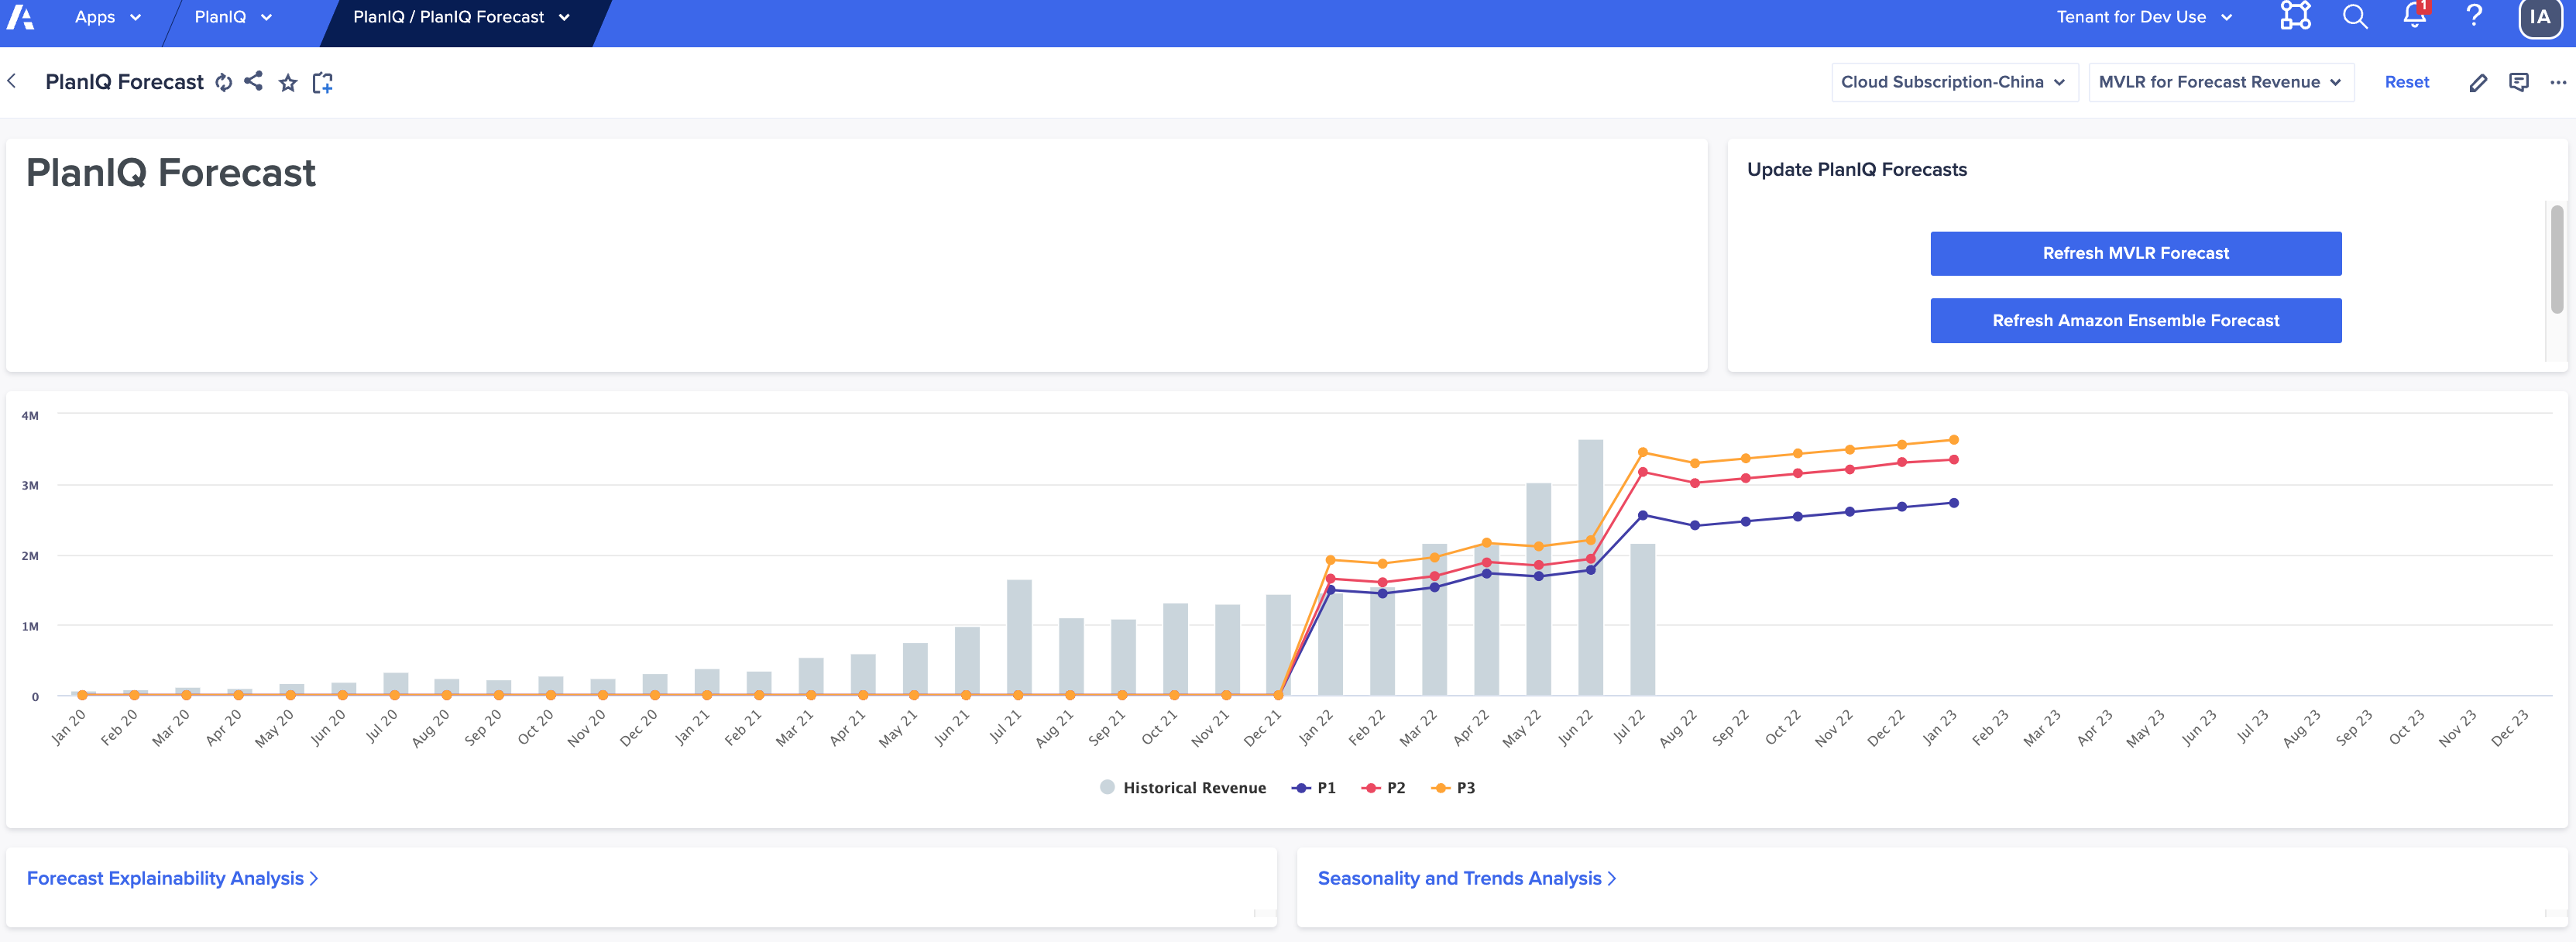
Above displays a Plan IQ forecast. In this example, you can refresh both the MVLR or Amazon Ensemble forecast results.