Boards are a type of page that provides end users with high-level information.
When you create a page, you can choose the type of page you want to build. Choose the board page type to display visualizations and highlight key data, so that users can carry out high-level comparisons and analysis.
Page builders and end users can view boards.
Page builders create and build boards in designer mode. Page builders use Board designer to lay out the data for end users to view.
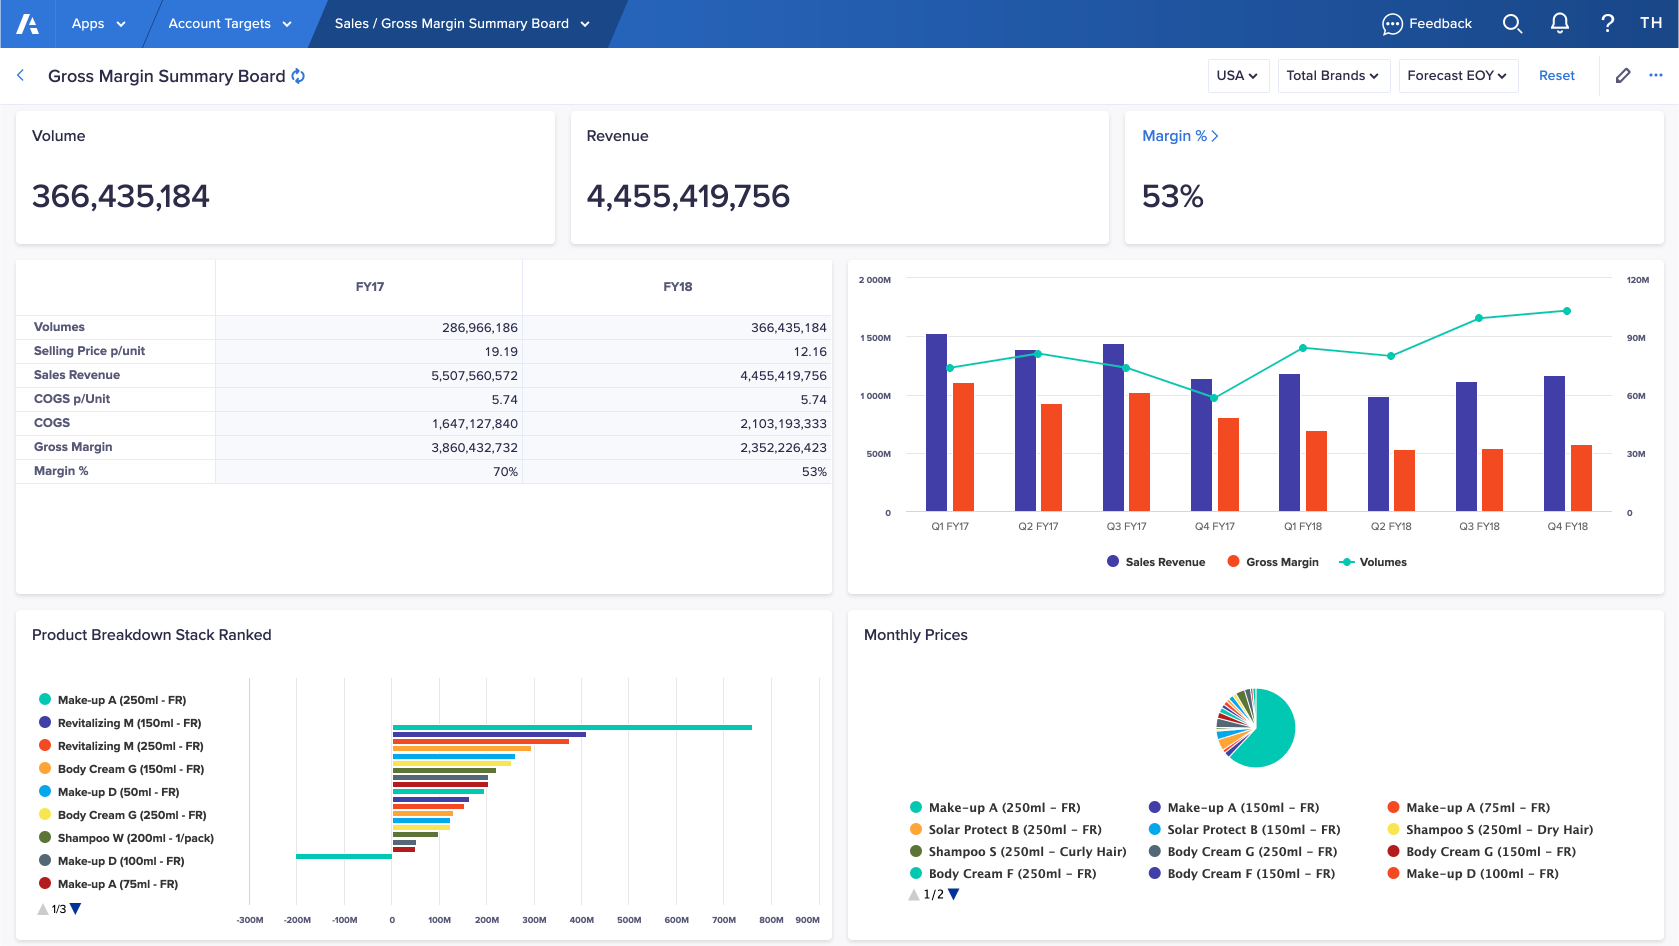
Below is an example of a board. The board displays different types of data against each other so end users can do a comparative analysis. The page builder creates each type of data display using various types of cards. The cards are all positioned on the page to create a board.
The dropdown lists in the top-right of the page are context selectors. Each context selector has a list of dimension values you can select from. The data display changes to reflect your context selection.
Learn how to:
Insights panel
The Insights panel, to the right of the board, provides a space for you to contextualize the data and add navigation. The Insights panel only displays for users if you add cards or links to it.
Select the arrow icon in the upper right to close the Insights panel. Select the arrow icon again to reopen the Insights panel.
Note: Individual user preferences override the default page setting. Your browser will remember the state of the Insights Panel the last time you logged in.
Select > Open by default to set the Insights panel to be open or closed by default.
Learn how to:
- Add cards to the Insights panel
- Add navigation in the Insights panel
- Set the default width for the Insights panel
- Show or hide card preview
Note: Synchronized scrolling and commenting are not supported on cards in Board Insight panels.

