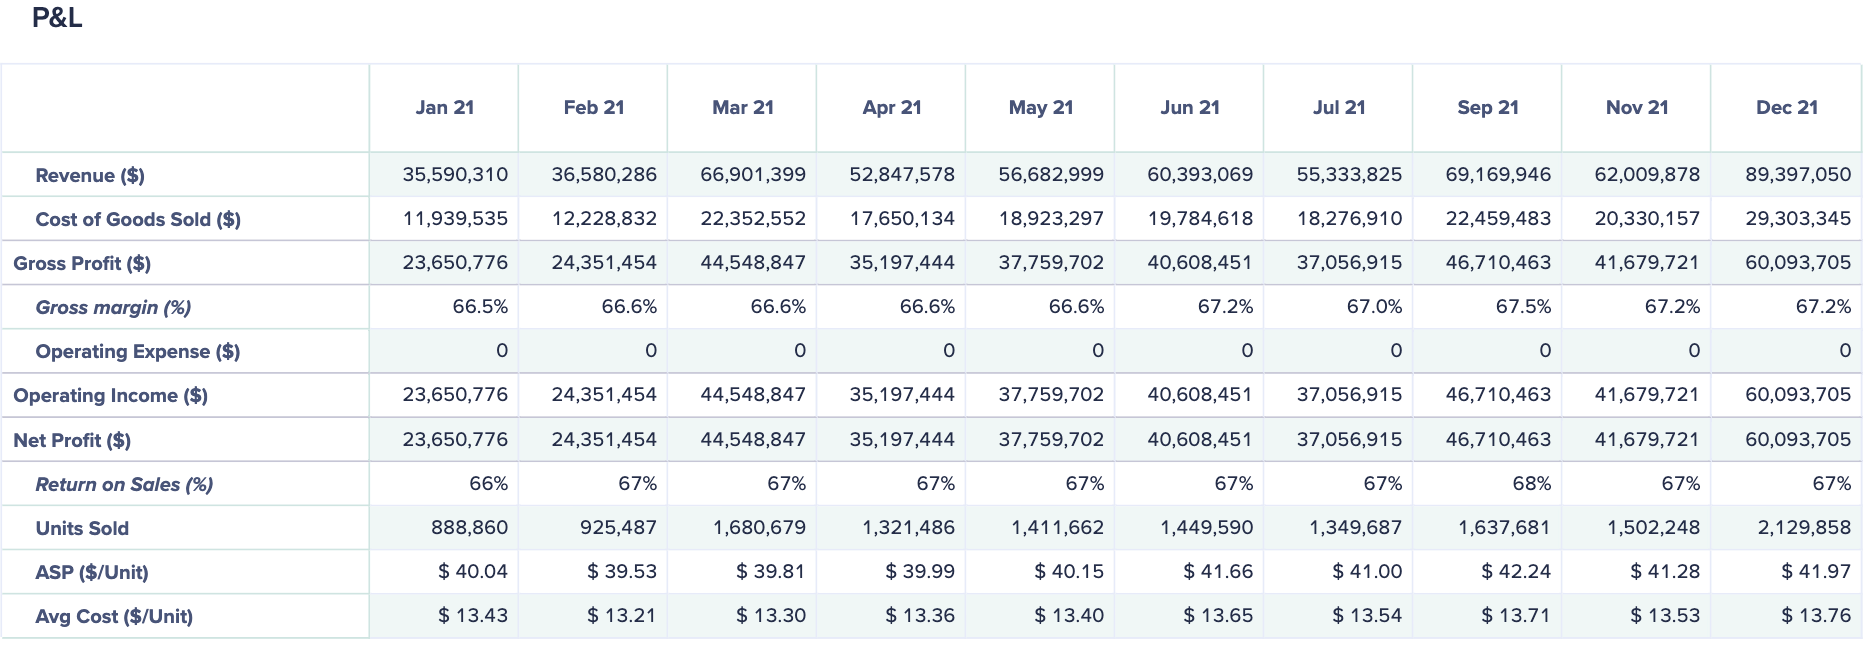
Table cards display tabular data in your reports to give context to data values. For example, in a profit and loss report.
Table cards are only available for use in report pages, and are suitable for grids of up to 300 rows and 50 columns. Grid cards are available for board and worksheet pages.
Your page builder configures the table view, including filters, order, and pivot. The number of columns is fixed when the page builder creates the card, but the columns displayed can change when the underlying list items or filters change.
You can use a table card to change the context of the report in the toolbar, if enabled by your page builder.

