You can manage how network charts display.
You can expand and zoom any section of the network chart on display. Use the menu items in the upper right corner to change your view of the chart. The menu choices are:
- Top-down
- Bottom-up
- Right to left
- Left to right
You can:
- Select and select Show all labels or Hide all labels to show or hide all connection labels
- Select a node and select to:
- Show current node flow only
- Hide selected node flow
Select > Show all nodes to show all hidden node flows.
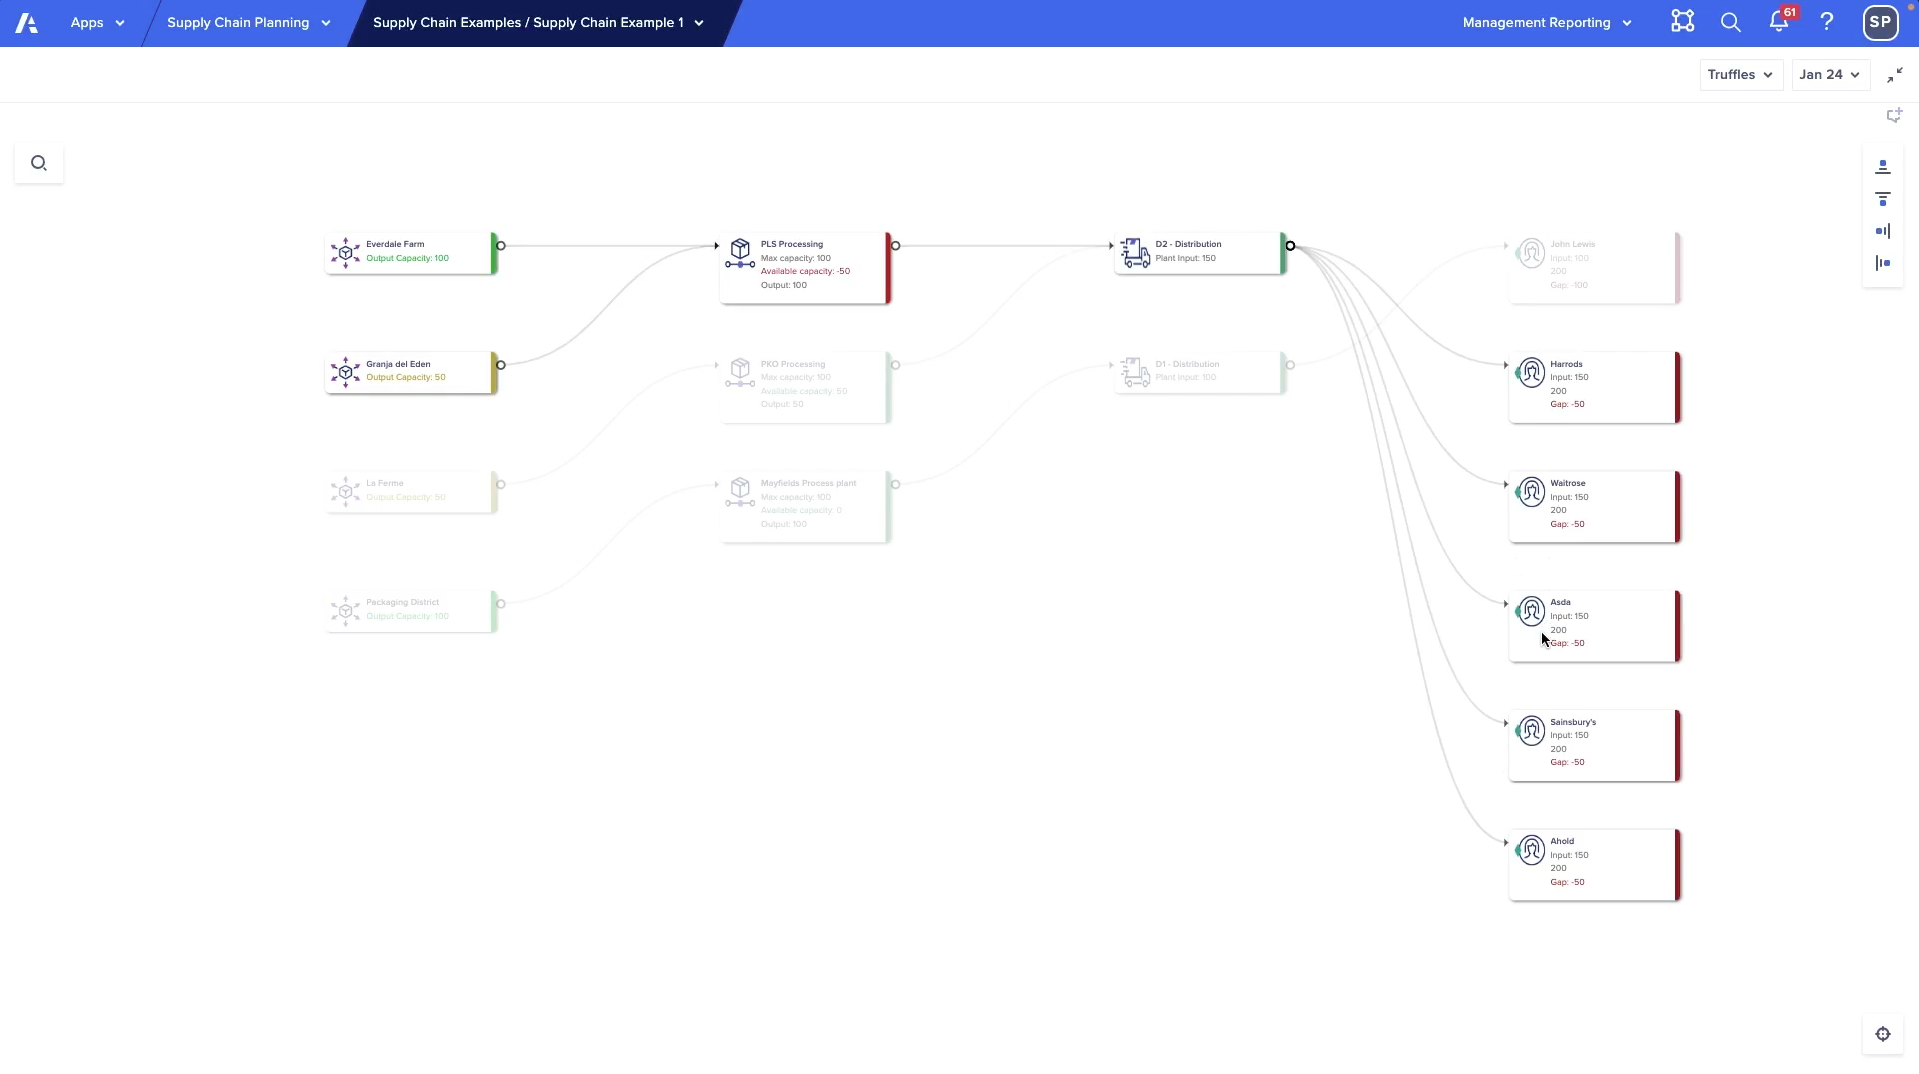
When you select a node, it is highlighted in the network chart along with the nodes that are connected to it, so you can see a clear end-to-end flow.
In the example shown below, the PLS Processing plant is being fed by two suppliers with the total output capacity of 150. The PLS processing plant only has a maximum capacity of 100, so it is currently over capacity and shows as red. This is carrying through to the customers, which are also shown in red, as the demands aren't being met.
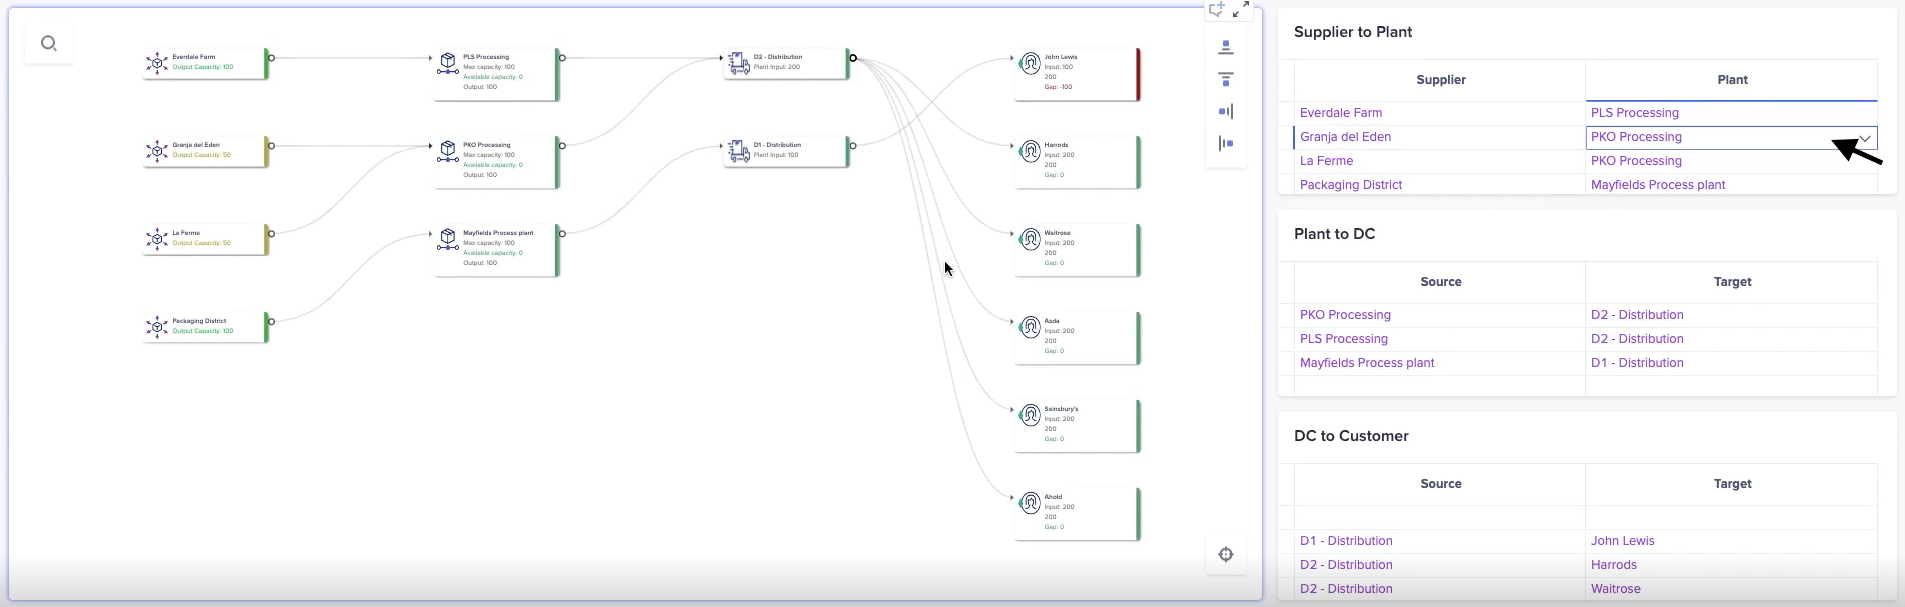
You can have an editable grid card alongside a network card to help you plan your supply chain network.
To update the supply chain network in the example:
- In the Supplier to Plant grid, we'll update the plant that Granja del Eden is supplying to from PLS Processing to PKO Processing.
- The network chart updates immediately to show that PLS Processing is no longer over capacity and is displaying as green. It flows through to customers, whose demands can now be met.