Add a text card to a board, worksheet, or report page, to help users understand their data. For example, you can describe grid dimensions or the cards displayed in the Additional insights panel of a worksheet.
You can also use dynamic text to add values from lists or line items in your module, which update automatically based on page context selectors. For example, if you set Revenue as the dynamic value in the text card, changing the context selector for a region will update it to display the Revenue for the selected region.
To configure a text card:
- Select Edit this page to open your page in designer mode.
- Select Configure on a new card, or hover over your card and select Edit .
- In the Overview tab of the Card configuration panel, you can:
- Select a Module if you want to use dynamic text.
- Enter a Title, Title color, and Description.
- Link the card's title to a page from the Link to a page dropdown.
- Select Card settings to switch Allow comments, Allow maximizing, and Display card background on and off.
- On the Context tab, you can configure context selectors.
- Drag and drop your card where you want it to display.
- Select Save to save as a draft, or select Publish.
Use rich text on a text card
To format rich text for all text in a card, or selected paragraphs of text:
- Select the card or paragraph.
- In the toolbar, you can apply these rich text formats:
- Style, for example, Normal text, or Heading 1.
- Font size and color
- Bold
- Italic
- Underline
- Strikethrough
- Left alignment
- Center alignment
- Right alignment
- Justify
- Bullet-point list
- Numbered list
Use dynamic text on a text card
You can add values from your model directly into your text card using dynamic text. This text will then update dynamically according to your selected page context selectors. For example, you can display product sales across regions.
You can only use dynamic narrative if you selected a Module when configuring your text card.
To add dynamic text to a text card:
- Place the text cursor at an insertion point in a text card.
- In the toolbar, select Insert data.
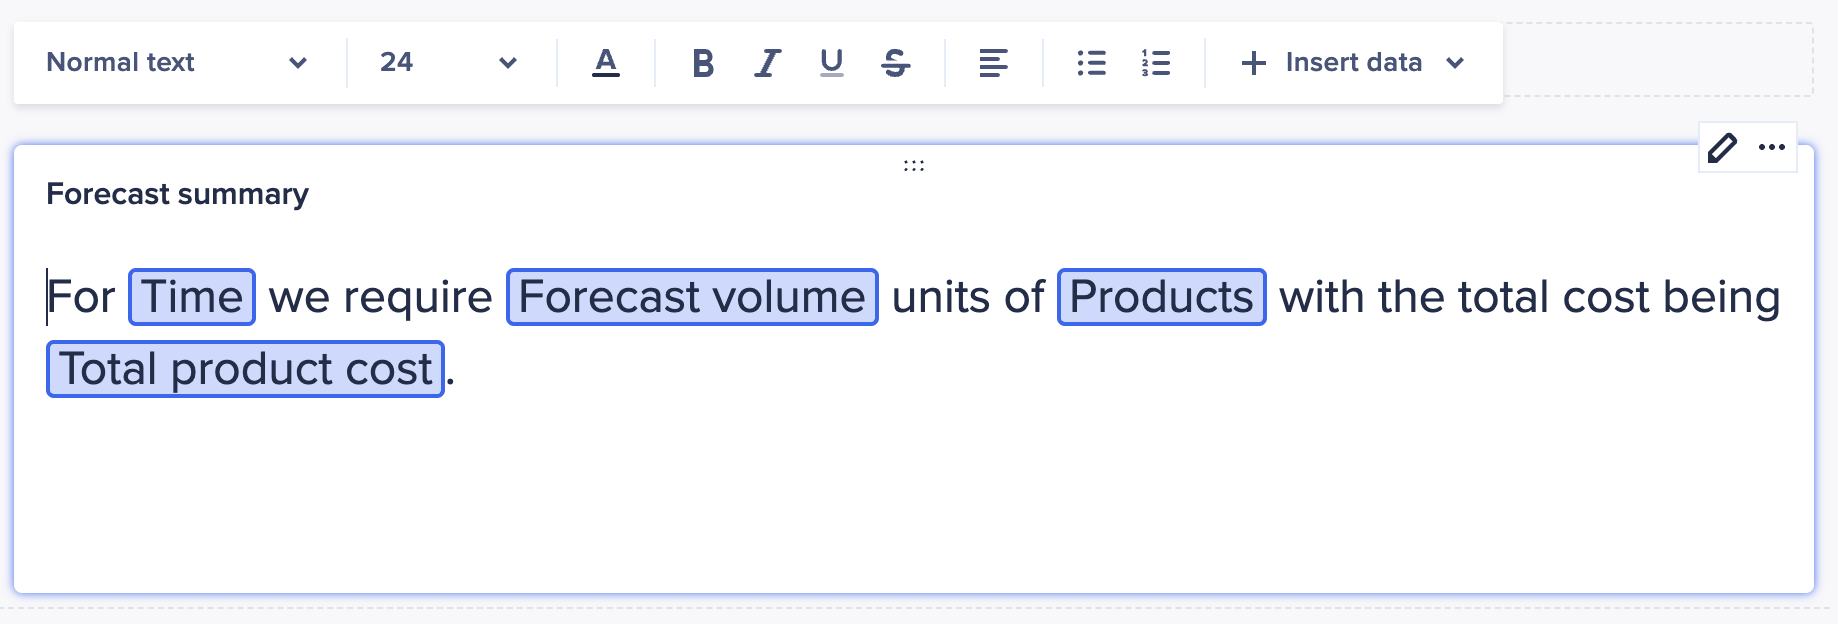
- Select a value. For example, if you are adding this text card to a forecast page with date and product context selectors, you might select
time,product,forecast volume, andtotal product cost.
- Optionally, add rich text.
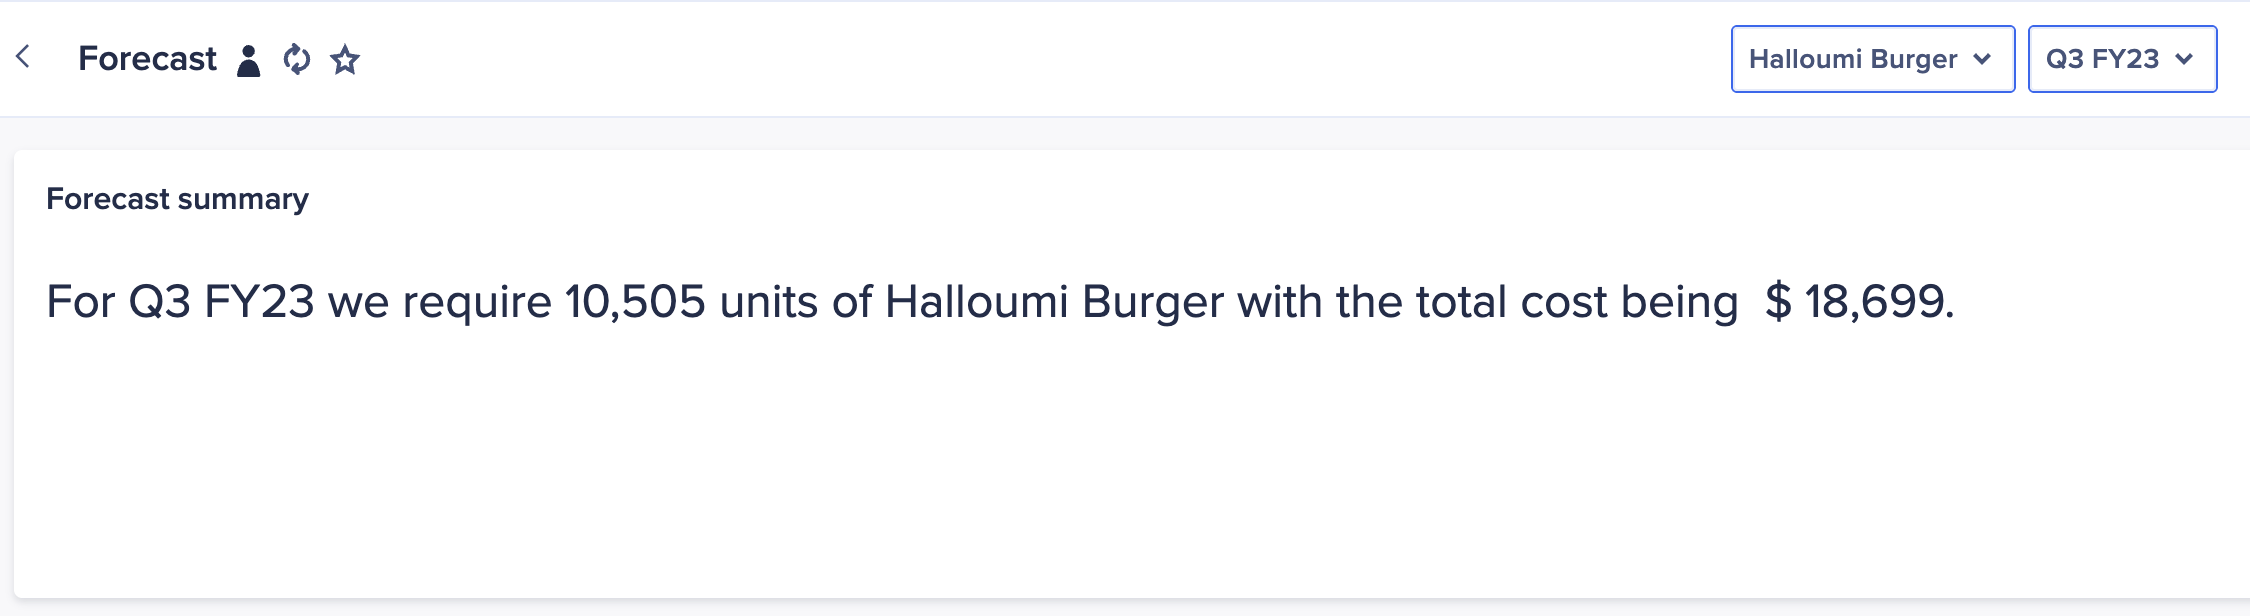
- The dynamic text displays as formatted values from the data. In the case of the example above, the dynamic text card would show the values for
time,product,forecast volume, andtotal costfor the date and product selected in the page context selector, and would update according to your selections.