Add tooltips instead of text boxes to buttons on dashboards and to grids or line items that have been published to dashboards. They take up less space and can provide instructions or guidelines for your users.
Classic dashboards are not supported for new customers. Build Apps or Pages in the User Experience instead.
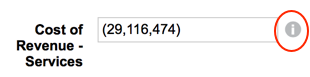
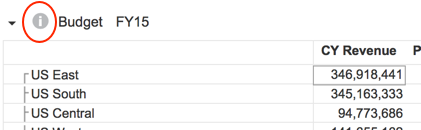
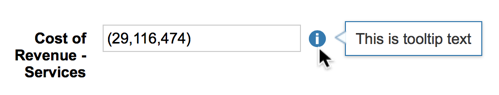
You can display an information icon to alert users to the existence of a tooltip, for line items and grids on a dashboard. Hovering over the icon will cause the tooltip to display. If you choose not to display the icon, the tooltip will display when a user hovers over the name of the grid or line item.
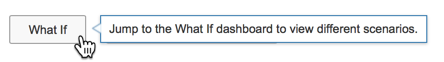
Dashboard buttons do not have anywhere to display an icon, so the tooltip displays when users hover over the button.
Add a tooltip
To add a tooltip to a line item, grid, or button:
- Select a line item, grid, or button on the Dashboard Designer Canvas.
- Navigate to the Usability section in the Dashboard Designer properties panel.
- Enter the text you want to display in the Tooltip field.
- Optionally, select the Display Icon option to display the tooltip icon for a line item or grid. The option is not available for dashboard buttons.
- If the dashboard toolbar is hidden, right-click the dashboard tab, and select Show/Hide in the dashboard toolbar.
In Anaplan Classic, select the dashboard tab. - Select Save & Exit to publish the dashboard.
This icon is displayed on the grid or line item:
| Line items | Grids |
 |  |
When the user hovers over the icon, it changes color and the tooltip text is displayed.
| Line items | Grids |
 | 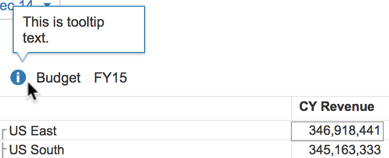 |
When the user hovers the mouse pointer over a dashboard button, the tooltip is displayed.