An additional column can control the levels of a tree slicer based on an Excel range.
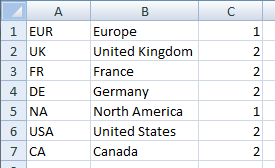
For example, the screenshot below shows a list of two continents and some of their children. Each continent has its own region code. This range of cells contains three columns: the region code, the caption, and the depth to be used for each item. When the user selects a region, its corresponding region code should be outputted.
Create a slicer:
- Select the Anaplan XL > Slicer > Excel ribbon item.
- Set the slicer range to cells =$A$1:$C$7, and select the treeview-style slicer.
- In the Properties section, check Update range with selection, choose First Column, and enter the cell where you want the country code to be shown. In this example, it's B11.
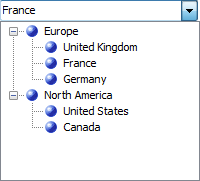
The slicer is created using the selections that we have chosen, with Europe and North America at higher levels than their children's countries. When you select a slicer option, in this case, France, its corresponding country code is displayed in cell B11.

