You can use page selectors and nested dimensions to add more dimensions to the context of your data. Without these, you could only have one dimension on rows and one on columns.
Workspace administrators can arrange dimensions as nested, or put them on pages, when they create a module or saved view. Any user can pivot the view to change how the data displays, but their changes only last for their current browser session.
Page selectors
If you place a dimension on pages, the data that displays in the grid only relates to the item currently selected in the page selector. Users can select a different item to see data that relates to the new item.
You can display any dimension as a page selector. In modules and on dashboards, page selectors display as dropdowns above the grid. One page selector displays for each dimension.
For Time or Versions, the default value for a page selector matches the model's current period or current version. You can configure page selectors on dashboards, to change the default value for Time and Versions page selectors.
Example
Suppose you want a module that displays margin data for products, but you want to be able to see that data according to different time periods and countries.
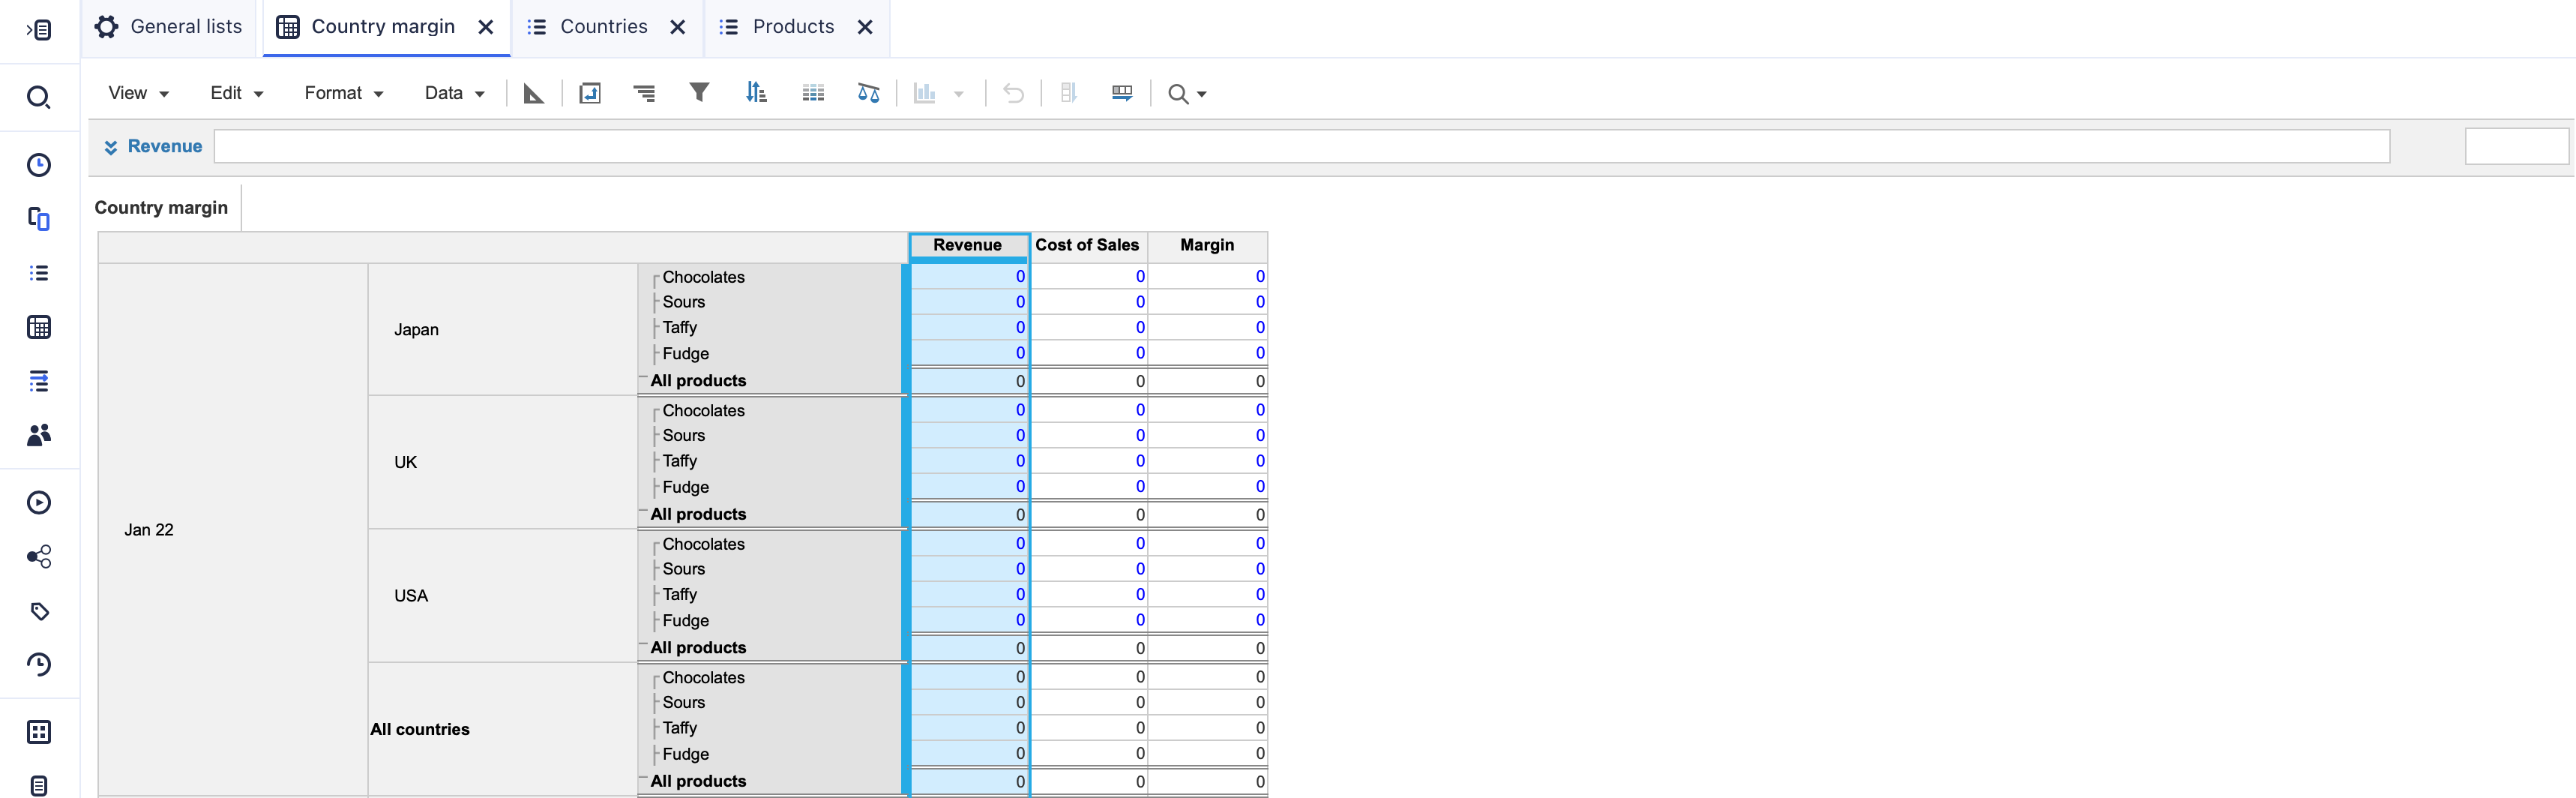
You can create a Country Margin module that has a Products list on rows and has line items for Revenue, Cost of Sales, and Margin on columns. To add further context to the data, you can add Time and a Countries list as page selectors.
| FY23 | USA |
| Revenue | Cost of Sales | Margin | |
| Chocolates | 2,675,773 | 744,867 | 1,930,906 |
| Sours | 3,132,459 | 805,269 | 2,327,190 |
| Taffy | 3,436,924 | 843,154 | 2,593,771 |
| Fudge | 1,957,370 | 520,075 | 1,437,295 |
| All Products | 11,202,526 | 2,913,365 | 8,289,161 |
This grid has FY23 selected in the Time page selector and USA selected in the Countries page selectors. So the grid displays data for the USA for financial year 2023.
Page selectors on dashboards
Workspace administrators can publish a page selector to a dashboard by itself. If you enable synchonized paging, you can use the page selector to define the context for all dashboards and modules that use that dimension. If you disable synchronized paging, modules and dashboards that share that dimension can display different contexts.
Nested dimensions
You can nest up to three dimensions on rows or columns as an alternative way to add further context to your data.
Note: In Polaris, you can nest up to 8 dimensions on an axis.
You nest on the New Module or Pivot screen, when you place more than one dimension on rows or columns. The top dimension becomes the outer dimension on the grid and the bottom dimension the inner dimension.
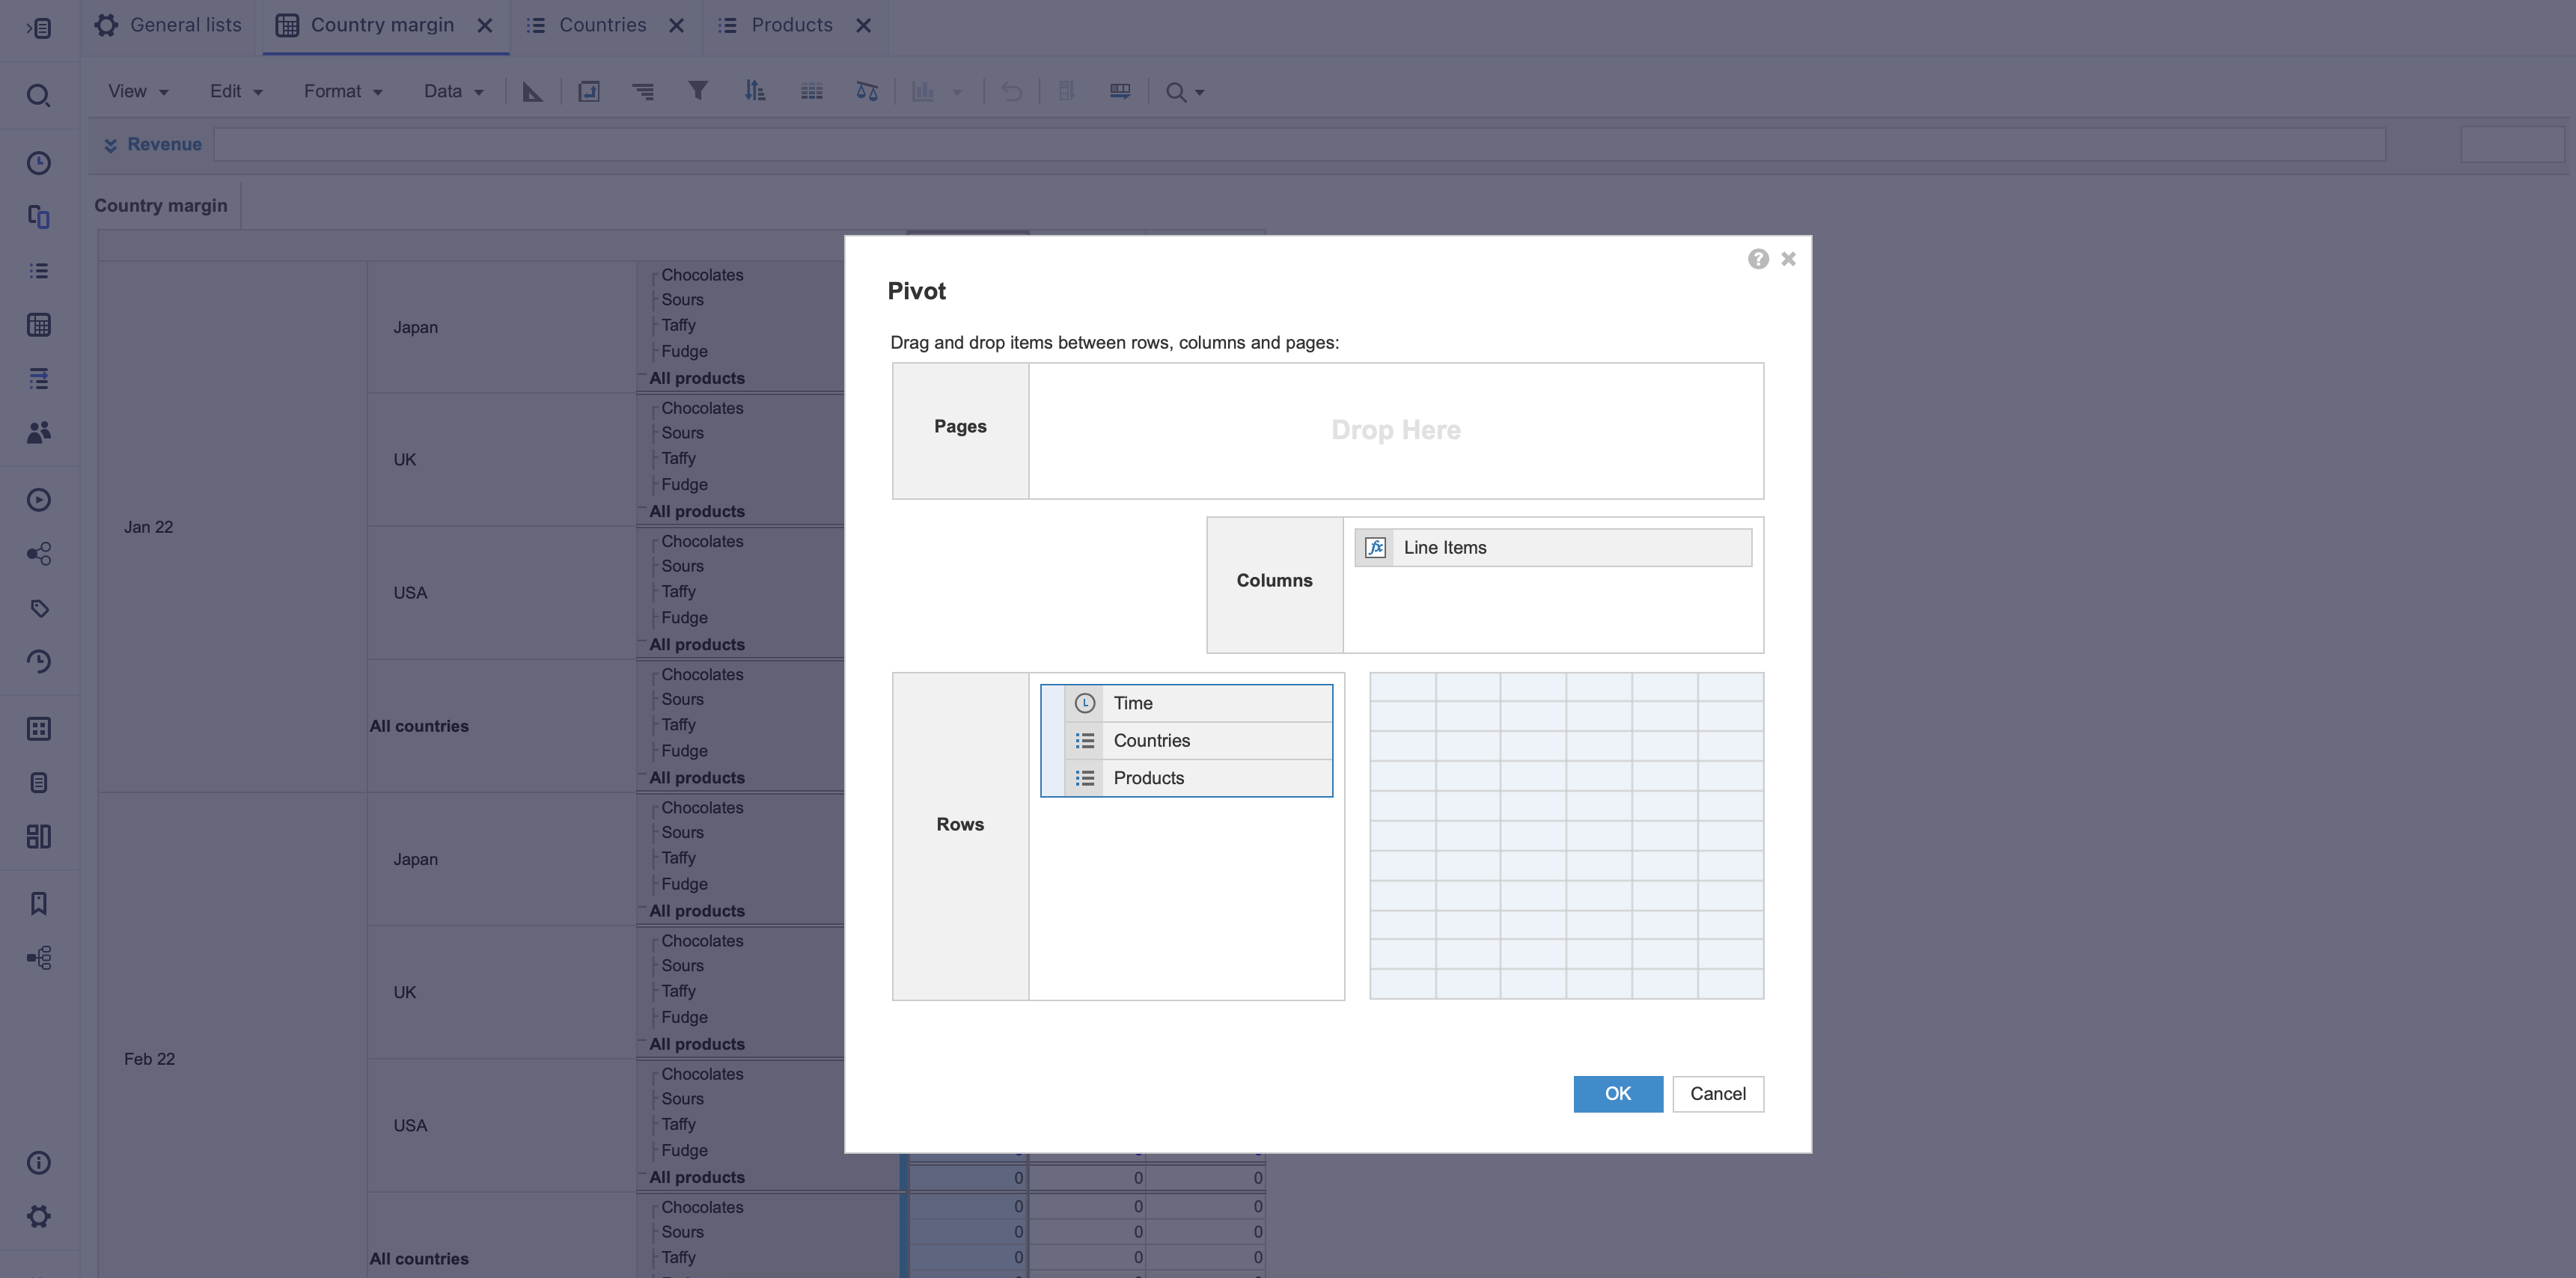
Each item in the outer dimension has each item from the next dimension as a separate row within it. If you nest three dimensions, each item from the middle dimension has a row for each item in the inner dimension within that.
Note: If your module contains large amounts of data, it's best practice to use page selectors so the data is easy to view.

