Create a member set in Excel to define the members returned on an axis based on cell contents.
Creating an Excel member set is more flexible than defining hierarchy members in Excel. The member set enables you to control which member combinations are displayed, rather than relying on the grid's cross-join behavior.
You may leave a cell empty to use the hierarchy's default member. Hierarchies and their members must be specified, so formulas can adjust the grid layout as needed.
Example
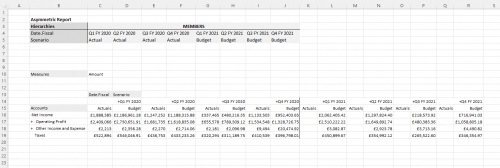
You want to display the actuals for 2020 and the budget for 2021. This gives us the numbers for the past year and avoids showing empty columns for the year to come. Set up an Excel range that contains the members you want returned that'll help in further selections.
To do this:
- Select Keep > Define Member Set in Excel from the Anaplan XL Grid ribbon.
Note: The selected Excel cell's position controls the defined axis. If the cursor isn't in the Column or Rows members area, columns is selected as the default.
- Name your set by selecting the hierarchies and members within the report in the Design Set dialog.

You can update the displayed members by typing directly into the Excel cells. Formulas are also supported, allowing you to set up calculations that automatically adjust which members are shown.

