Interactive charts gives you interactive, chart-driven reporting.
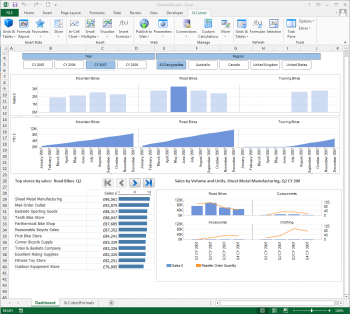
This is achieved by extending the dynamic charts in the product. You can select a chart or a data point in a chart and have the rest of the report updated in context. For example, in the example below, you can choose Road Bikes, Q2 and the ranking table below has been changed to match your choice.
Dynamci charts give you:
- Full control over selected chart and chart area, with associated formatting
- More control over axis and title formatting
- In addition to cubes, dynamic charts can also be built from an Excel Range or directly from SQL.
Chart selections
When building reports, you can track any selected element of a small multiple chart. This includes an axis element, an individual chart, or any data point in the chart. This information can be written into many Excel cells. Other parts of the report, such as grids and formulas, can be based on what is in these cells. The chart will also show by color which chart or data point is selected. This is handled by all unselected elements being displayed in a much lighter shade while the selected item retains the original color.

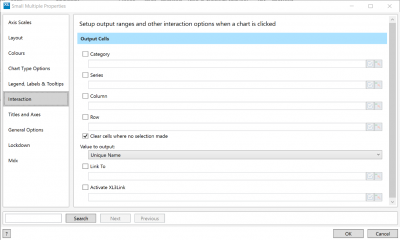
These output properties are configured in the properties for the chart control, as shown in the screenshot. To track an element, select the relevant checkbox and chose the desired output cell.
'Link to' is also available as an option, where the focus can be moved to another area of the report in the context of the selected chart or chart element.
Chart formatting
A more granular level of control is now provided for the axis and chart name elements within the chart control. This is available in properties as shown below.
SQL and Excel sourced charts
You can build dynamic charts from non-cube data. This can be any Excel range or directly from an SQL query or stored procedure. When inserting a small multiple chart from the Anaplan XL ribbon, you can now specify which data source this is for.
- Dynamic charts based on SQL
- Dynamic based on Excel ranges

