Hover over a data point on a small multiple to display a tooltip.
Tooltips show the category and value for that point by default. You can customize this in the dynamic chart properties.
You can add more values to be shown in the tooltip. To do this, set a values hierarchy in the task pane. The tooltips button is enabled at the top of the task pane, and you can specify additional members.
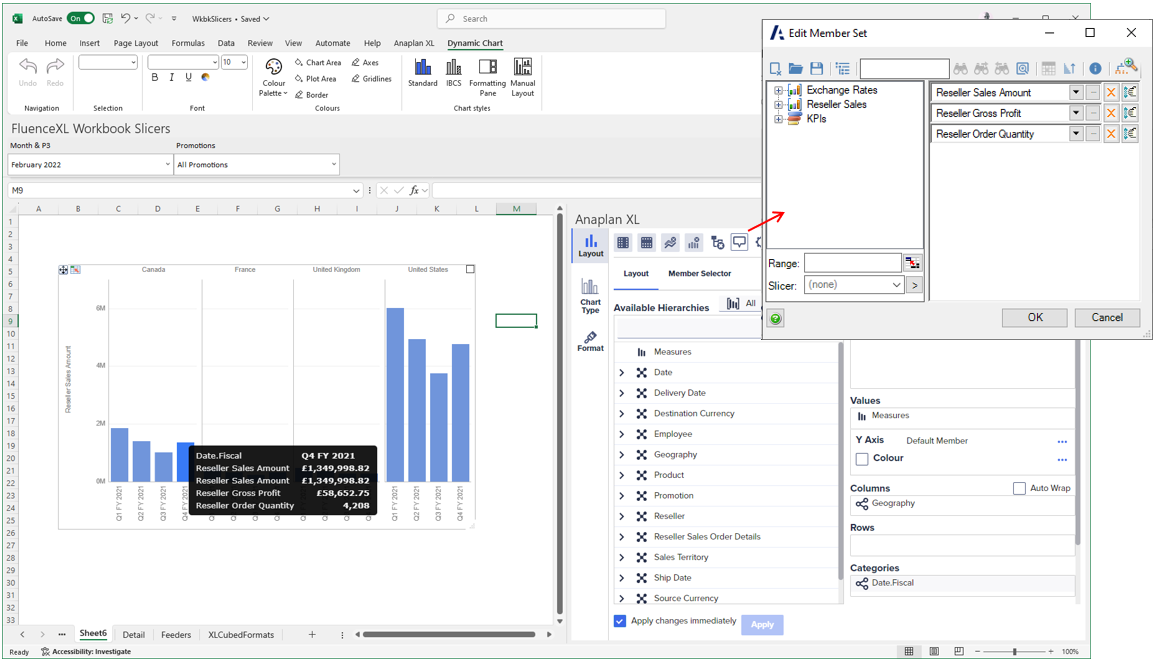
In the example below, the measures hierarchy has been placed in values and is plotting Reseller Sales Amount. The tooltip has been customized to also show the value for Reseller Gross Profit and ResellerOrder Quantity.