Learn about relationships between measures in dynamic charts.
Color coding
You can apply color coding to the data points to highlight differences.
- Drag the hierarchy to plot the measures to the values box and select the measure to be plotted (Y Axis).
- Select the Color box in the Options area of the Task Pane. This makes the color gradient active.
- Select the value to apply the gradient to. This can either be the same measure that is being charted or a different measure.
Change the colors used for charting using the button to the right of the color swatch.
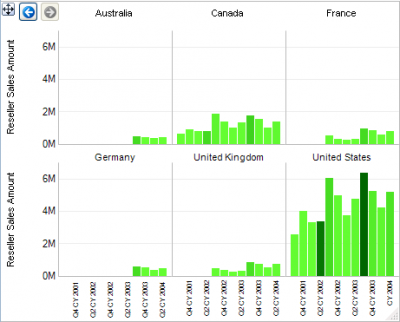
In the image below, the Reseller Sales Amount is plotted, and the chart is colored based on the Discount Amount. You can see that although there were large volumes of Sales in the USA they were also the most heavily discounted.
Color and gradient picker
The color gradient picker is used to determine both the colors and the rate at which the color changes. This can have a dramatic effect on the impact on the data being displayed and is a valuable tool for making sure that data becomes information.
Here the only change was made to the center of the color bar.
Plot a second series using a second Y-axis
A series can be plotted on a second values axis by right-clicking on the series in the legend and selecting Series > Move to other axis. Select this option again to move it back to the original axis.
Scatter charts: plot a correlation
Select a scatter graph for the chart type. Set the Y-axis and X-axis by moving a measurement to Values, usually Measures. Select a member for each axis from the dropdowns or drive from an Excel range.
Color can be applied to the chart using a third measure.
Bubble or Bubble Ring chart types plot a third value as the size of the point.

