

The Advanced tab of the hierarchy editor offers more ways to make member selections.
When no additional filter is specified, advanced filtering is applied to the default column member in the hierarchy. In Anaplan, that default member is typically the All member or the first member in the hierarchy.
Advanced filtering options:
- Reduce manual selection work through dynamic logic-based selections — selections update when hierarchy members change
- Focus reports on what matters most without losing big-picture context
- Support executive-ready reporting through focused detail and contextual summaries
Anaplan line items often contain text or list values used for filtering. While this filtering is supported in Anaplan XL Reporting, the operation is resource-intensive and can affect performance.
As a best practice, explicitly select the column you want to filter on in the Additional filters section. This is especially true if you're unsure which column member is the default. This small step helps ensure your filter is applied exactly where you intend.
Open Report Designer, then after making selections for filters, columns, or rows, select the Advanced tab.
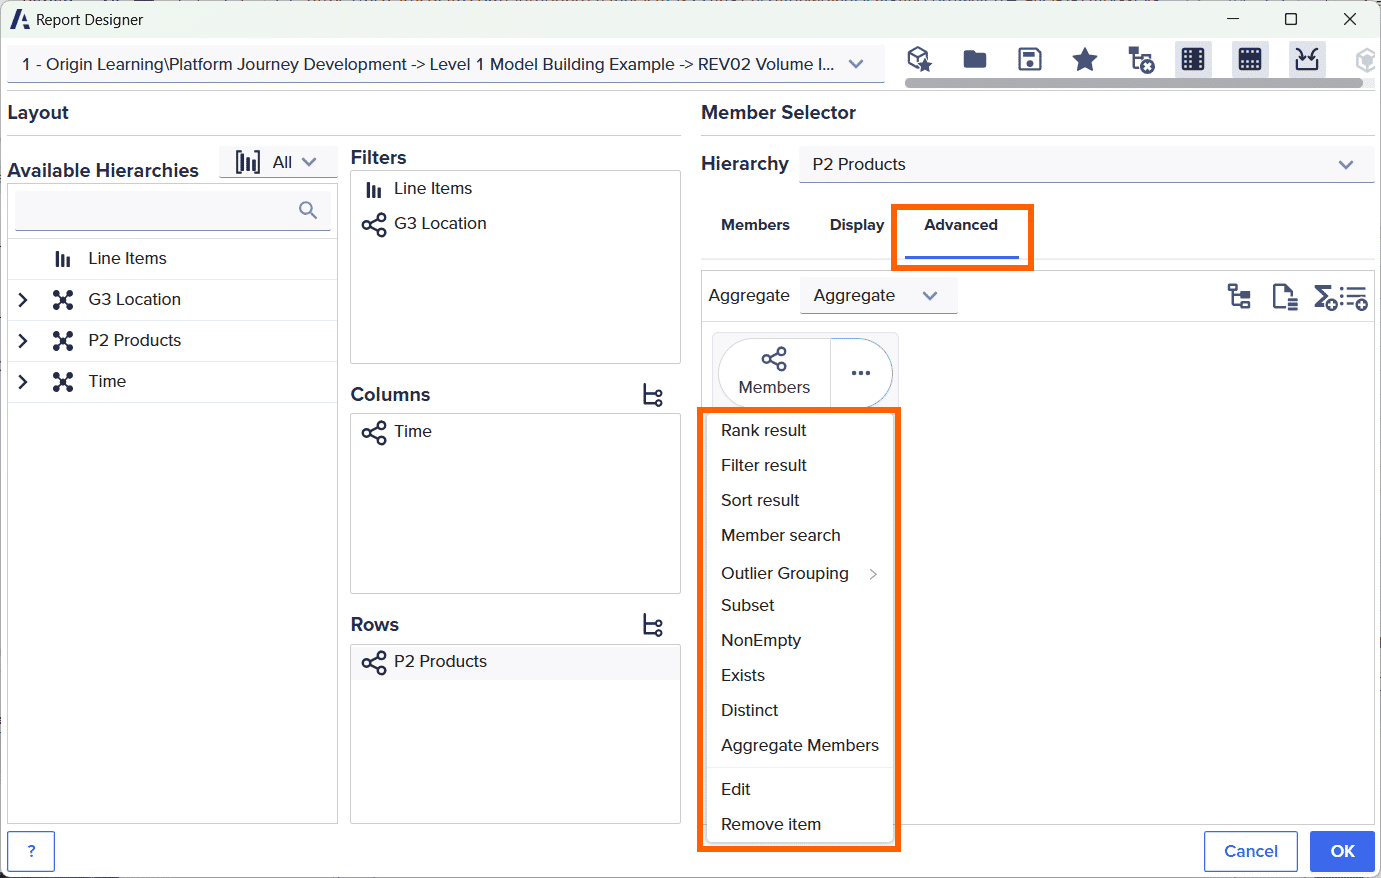
The advanced filtering options are:
| Filter option | Description |
| Rank | You can choose whether to display the top or bottom products. This can be determined by an Excel cell and how many members to display. |
| Filter | You can filter your hierarchies so your report only displays members that satisfy a certain condition. |
| Sort | You can select from several options to sort by in ascending or descending order. |
| Member search | You can filter a report by searching for members in a hierarchy. |
| Outlier grouping | Outlier grouping enables you to display a subset of the selected members grouped together into a common set, often called Others. You can select the criteria to define the group and give it a name. Additionally, you can choose a member to always be shown, regardless of whether it appears on the list. |
| Subset | You can take a subset of any member list with the subset option. This enables you to take a top or bottom selection of the returned members, or the top members with an offset. For example, you could sort the members by your chosen measure, then take a subset to return the top 10 starting after the third member. |
| NonEmpty | You can add a non-empty to a set of members. This enables you to reduce the set of members in a result set, potentially increasing performance. |
| Exists | This does not apply when connecting to Anaplan data. |
| Distinct | You can removes duplicates from a list of members. |
| Aggregate members | You can select a list of members to aggregate, sum, or find the average, maximum, or minimum. |
| Edit | This edits the item that you selected. |
| Remove item | This removes the item that you selected. |
Note: For best performance, keep filtering grids small and separate from larger, more complex data grids.
Member Lists
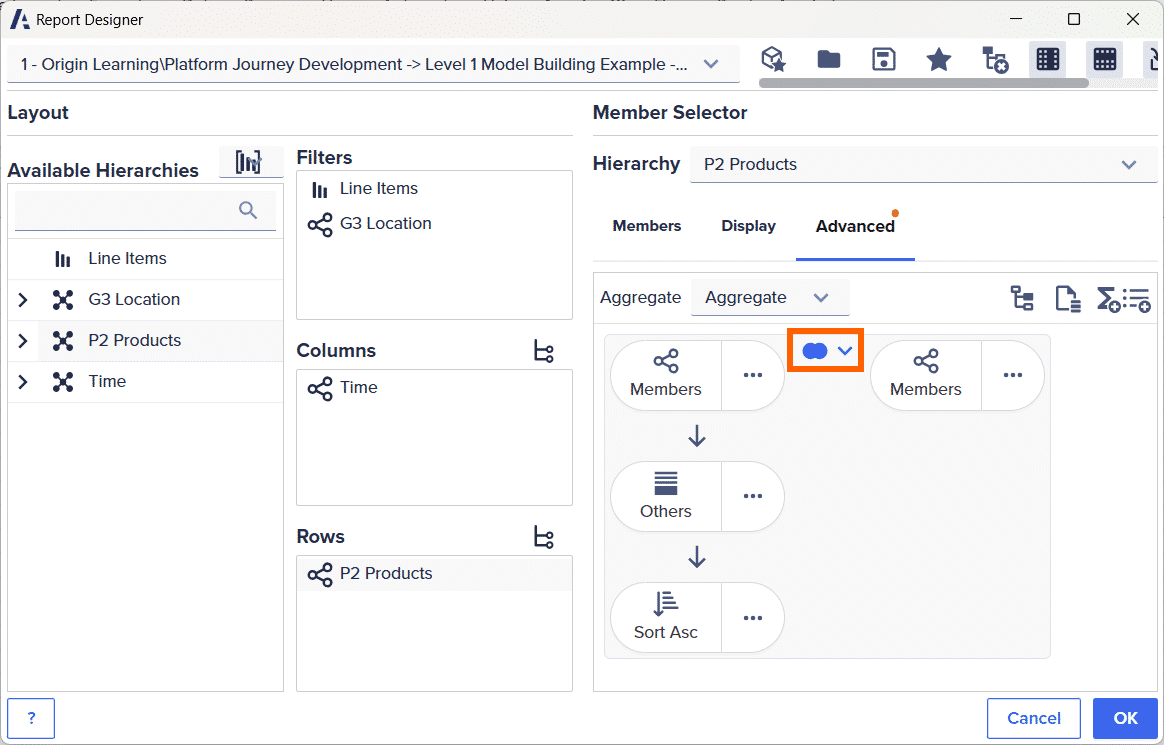
In the Advanced tab, you can add an additional member list, make selections as usual, and then choose how to combine the two lists. The member list on the left applies logic to the member list on the right. This is done by selecting the dropdown at the two blue dots. You can apply logic to member lists:
- Add - left and right sides combined. If Add is selected, the left and right member lists are combined.
- Common - must exist on left and right side. If Common is selected, the listed members are those that exist in both the left and right member lists.
- Subtract - left side minus right side. If Subtract is selected, the right member list is subtracted from the left member list.
For examples, see:
Aggregate options
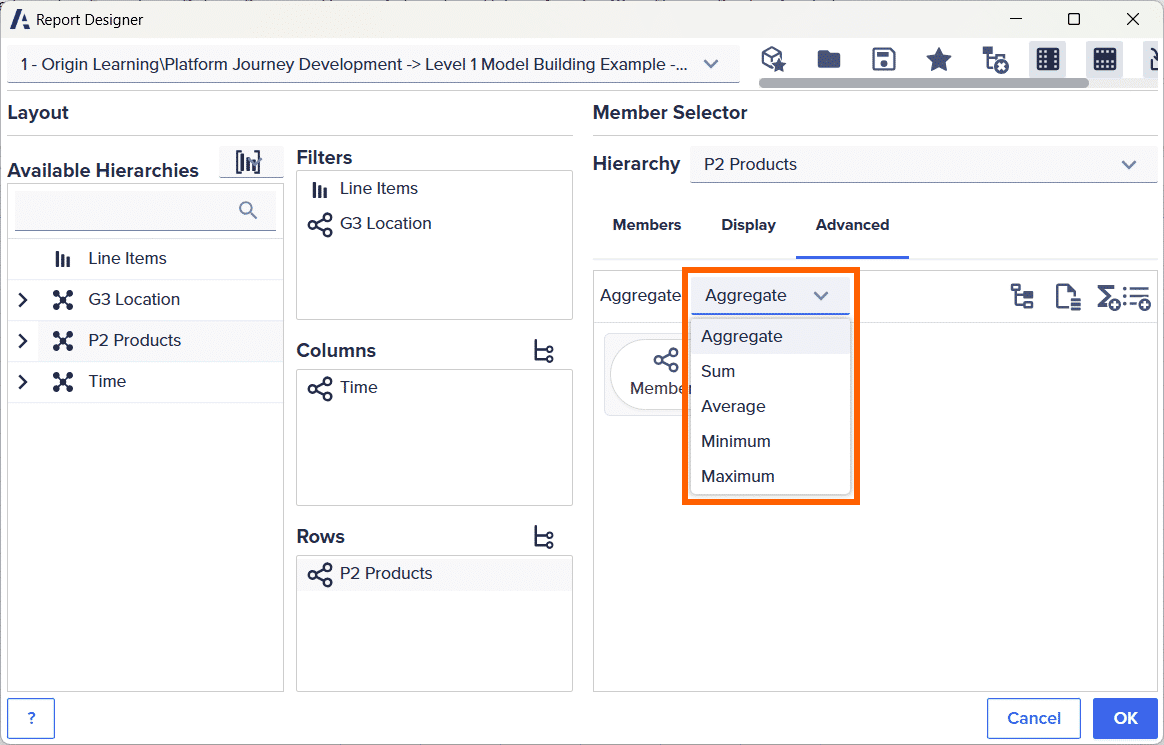
In the Advanced tab, you can access the Aggregate dropdown, which contains several options:
- Aggregate - Combines the values
- Sum - Calculates the sum of all values
- Average - Calculates the average of all values
- Minimum - Returns the minimum value
- Maximum - Returns the maximum value
Named sets
A named set is a Multidimensional Expressions (MDX) expression that returns a set of dimension members. Named sets can be created at the cube level or within an application such as Anaplan XL Reporting. They can be created by combining cube data, arithmetic operators, numbers, and functions.
View here for more information on creating named sets.
Between and Manual MDX are available on the Advanced tab >Member set when editing hierarchies.
Between
This option allows the user to report for a particular range on that hierarchy. The only criterion is that both members must be at the same level. For example, we can choose to report all data between 2022 and 2023:
There's also an option to enter an Excel range. You can run the grid report based on values in $I$3 and $I$4. The start range value is in $I$3, and the last range value is $I$4.
Another feature of the range option is that you can leave one of the ranges blank.
| Value in $I$3 | Value in $I$4 | What will be reported |
| CY2022 | CY2024 | Grid report will report data starting CY 2022 through to CY 2024 |
| CY2024 | Grid report will report data starting from earliest date through to CY 2024 | |
| CY2023 | Grid report will report data from CY 2023 through to latest date |
Manual MDX
This option allows you to use MDX code. Select the ellipse to the right of the Manual MDX radio button and you will be able to enter MDX code.
For example, if you only want to report CY 2022 and CY 2024 you would enter {[CY 2022], {CY 2024]} in the Manual MDX window. You can also specify an Excel cell range as the MDX source. Once you have defined your named set you can then select to report Descendants, Lowest Descendants, or Descendants At.
Hide Levels
This option allows you to select which levels when you drill down the hierarchy. Deselect a level to skip that level when you drill.

