Many standard reports use data from the Excel workbook to influence your grids. Driving dimensions from a range provides a simple way to do this, especially when multiple grids use the same parameters.
If the input to the grid contains members that aren't found in the cube, then you can hide the error that is shown for invalid members. See the Grid properties Display error on invalid members option.
Example
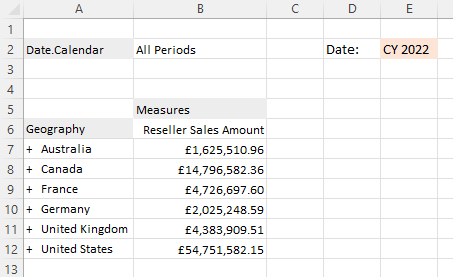
Here's a simple grid with cell E2 set up as the Excel range to drive which calendar periods are displayed.
- Edit the Calendar Date hierarchy to use E2 as its input.
- Select the Excel range button and select E2 as the driving range. The selected range is added to the list of selections.
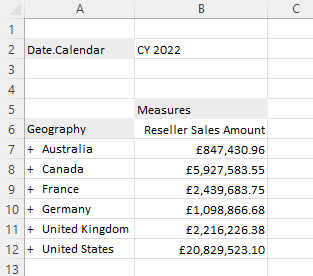
- Select OK. The grid updates to use the new range for the Date Calendar hierarchy.
You can also use an Excel range to drive the grid rows:
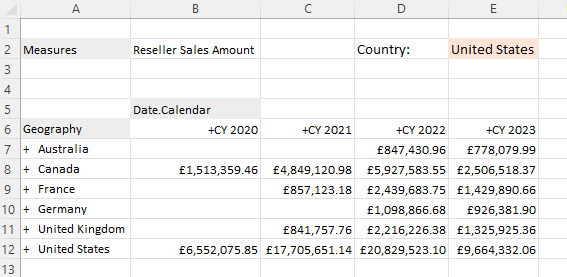
Edit the Geography hierarchy to use E2 as its input by selecting the Excel range button > E2 as the driving range, then select OK.
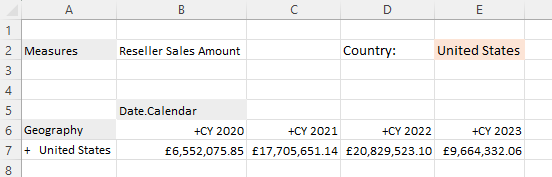
The grid updates to use the new range for the Geography hierarchy.
Additionally, you can change the selection to include children, descendants, and so on.
The Excel range can also be across multiple cells. The grid changes automatically because of a grid setting: Grid properties > Behaviour > Refresh when driving cells change. If you want to update it manually, clear this setting.
You can also use a named range in the same way as an Excel range to drive your grid. See Named grid ranges for more information.

