Grid reports can be driven from the currently selected range of another grid.
Example
You would like one grid to show a high-level summary of time against region. Then a second grid to be driven from the first, showing a breakdown of products against months for that region.
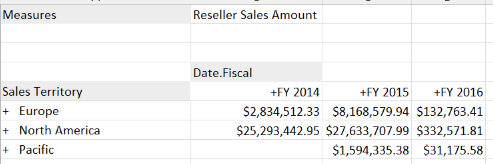
- Insert the first grid, with years on columns and territories on rows:
- From the grid's right-click menu, choose Anaplan XL > Properties, then select Interaction > Track grid's active cell. Optionally, also turn on Apply tracking formatting.
- Insert a second grid. Select the Time hierarchy on columns.
- From the Active cell dropdown, select Descendants at quarter.
- Select Product members on rows, for example, Lowest Descendants of Mountain Bikes).
- Select the Region hierarchy on headers, selecting the Active cell option.
Selecting the different data items in the first grid selects the appropriate members in the second grid:
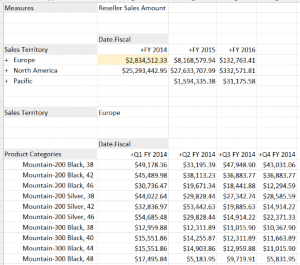
Europe, 2014

North America, 2015
Output Row/Column Members to
The selected grid members will be copied to the selected cells. This allows formulas to be driven from active selection, for example.
If you have several hierarchies on rows or columns, you can select a range, and the members of the cross-join will be put into each cell.
On Click Navigate to
After selecting cells, the selection is immediately changed to this cell. This allows the results to be highlighted or the worksheet to be changed.
Apply Tracking Formatting
The tracked and currently selected cells are highlighted, as specified on the XLCubedFormats worksheet (see the Tracked Cell and Active Tracking Cell formats).
Track on Member Cells
This option allows you to track clicks in the members of a grid and the data areas.

