You can format in Anaplan XL Reporting in three ways.
- Measure formatting: Select a measure in the Anaplan XL member selector, and apply a numeric format to the selected measure.
- Using the right-click menu: Right-click any member in the row or column area of a grid, choose Anaplan XL > Formatting, and apply a format to that cell.
- Format sheet: This controls the basic formatting for a grid, in terms of the overall color scheme and fonts. Any user applied formatting from the two methods is also stored here.
Format measures
You can format a measure by selecting the Edit button.
This writes a line to the format sheet where any edits can be made if required.
The right-click menu
Right-click a row or column header to format the selected member or level. To format a grid value, select the cell, and right-click, select Anaplan XL > Formatting > Format this Cell.
Any formatting applied in this way is written to the Format sheet.
Format a member
To format a single member in grid, right-click the relevant row or column and select Anaplan XL > Formatting > Format this Member.
After submitting, formatting is applied to the member's name and its values. You can do further editing to the format sheet. You can either change the member name and not the values, or make quick changes.
Format a sheet
This shows the default format settings for grids. You can change the default settings by updating the format sheet file. See Anaplan XL Options.

Rows 5 to 16 define the basic formatting for a grid. By directly formatting the relevant cells here using native Excel, you can control the font style and color and cell background of the labels, the grid header and row and column headers and members.
Row 47 onwards is for formatting applied to individual slices of a grid, normally when you format a particular member. This area is updated automatically when formatting is applied using Anaplan XL's right-click menu.
If you have more than one grid in your workbook and you need to apply different formatting to each grid, you need to name the grid (through Grid Properties) and then refer to each specific grid in this area in column B. Please note: There's an empty row between each slice highlight, so that the borders don't conflict with each other.
Any updates you make directly on the format sheet are applied the next time the grid is refreshed
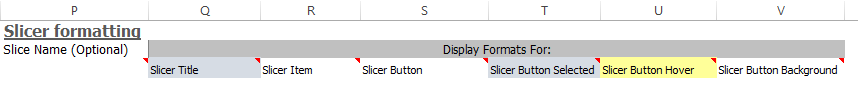
Cells Q2 to V3 in the format sheet hold Anaplan XL slicer settings. Here you can change the display format for the slicer title, slicer buttons and slicer items.
Upgrade workbooks
If you start a new workbook, you automatically get the new format worksheet. You can upgrade workbooks built in older versions to the new formatting by going to Workbook Options > Reset Format sheet.
You can keep any changes you made during the upgrade. Once the upgrade is done, the old format sheet will be changed and can be safely deleted.
Advanced options
Select cell A16 to toggle the visibility of the advanced options. From here, set alternate row formatting and other writeback or grid active cell formatting.
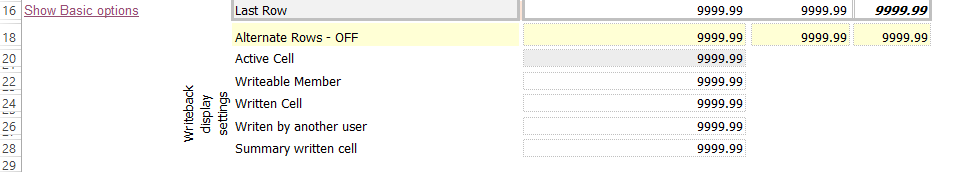
For example, to set the alternate row format, toggle the selector to Alternate Rows — On" The formats for the members and cells are applied for every other row.
Row 20 is for the formatting of the Active cell
Rows 22 to 28 are specific to writeback-enabled grids where you can write new values to the cube.
Format rows and columns
You can also set formatting on rows or columns for grid members.
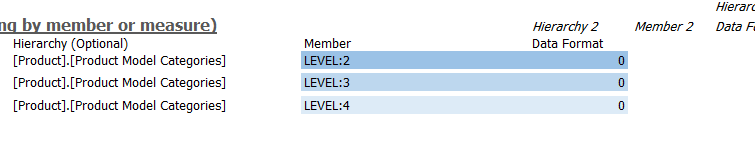
Create formatting as for levels, so that the format sheet looks something like this:
Change the hierarchy to ROWS:
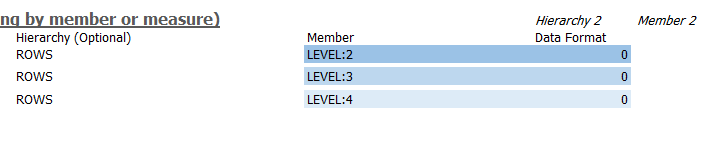
This format is applied for whichever hierarchy is on rows.
This can be included in the master format sheet so that all grids created have the same row format. The same applies to columns.
To target a specific hierarchy, specify the index you want, for example Columns:2
Format by member property
Format by property allows you to select the affected slice by a member property value. You need the full name of the property, and the property must be selected in the grid (although you can set the property's display style in Grid properties to member only so it isn't displayed).
You can get the full name of the property from the grid MDX in the Properties screen.
The format sheet is set as below:

The formatting is then applied to the grid based on the Color property.
Multiple hierarchies
Nest hierarchies in the format sheet by specifying the Hierarchy names and Member names in the respective columns ("Hierarchy 2", "Member 2", etc.) of the Slice Formatting section.
The example below uses the wildcard (*) to format all members in Product Subcategory under the "Bike" member.

The resulting grid has formatting across the whole row.
Format InCell charts
You can set a highlight on an InCell chart created in the member selector. Enter the hierarchy name , and in the member cell prefix the chart title name with AnaplanXLInCellChart:, for example AnaplanXLInCellChart:InCell Chart.
Format grid calculations
Grid Calculations can be formatted by adding the placeholder FluenceXLCalculation in the hierarchy column, and putting the calculation name as the member.
Format special levels
While the LEVEL:Number syntax highlights members of a level, it's also possible to use special identifiers to target specific members.
LEVEL:LEAFhighlights members of the hierarchy with no children.LEVEL:NOTLEAFhighlights members of the hierarchy with children.LEVEL:SUBTOTALhighlights subtotals created by Anaplan XL.
For these types, specify the hierarchy as usual and the LEVEL: part goes in the member cell.
When highlighting subtotals, the target hierarchy changes depending on the subtotal mode (Cube or Excel) as this affects the column where the subtotal appears.
Tag formats
These only apply to Anaplan XL API grids. You can tag members and apply formatting to members with the applicable tag. The syntax is.
TAG:#MyTagName
Data driven highlights
You can control highlights by external data. For example, use a SQL query to select the highlighted members.
Do this by adding extra custom highlight areas in the Appearance tab of the B screen. These use the same rules as the format sheet and should have Dimension/Member pairs of cells and then a data cell.
In custom areas, you don't have a grid name or spacer cells between each cell.
Workbook formats
Pre-made workbook-level formats are available from the Anaplan XL ribbon. This creates a new basic grid format on the format sheet which can then be edited as needed. Selecting a new workbook format doesn't overwrite any custom slice highlighting already defined.
Default formats
If you want to change the default formatting for all new workbooks, update the format sheet file, see Anaplan XL Options. Update the formatting on the StyleDefault tab, then save and distribute this format file as required

