Stephen Few invented bandlines as an extension of Edward Tufte's Sparklines.
Bandlines are meant to help you understand a column of Sparklines by giving more information about the scale or numbers without using a shared scale. This will often make the trendline for smaller series look flat. More detailed design goals and background information are available here[1].
In Anaplan XL, bandlines are implemented as a background option for the SparkLine Chart Designer.
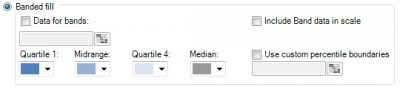
To add bandlines to an existing sparkline, edit the sparkline to format it, select the Background tab, and then turn on Banded Fill.
Bandlines are used to show how data is spread across a defined set. The user can decide how this is shown. The user can set the background color for Quartile 1, the Midrange (Q2 & Q3), and Quartile 4, along with the color of the Median line.
There are several approaches to displaying the band's information:
- Use the data set being plotted to define the quartile bands (the default)
If you plot 28 days of data, the trendline will be based on each row of data. But the banding detail is calculated from the whole set of data being plotted.
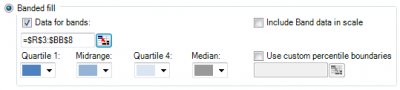
- Use an extended/alternate range to define the quartile bands
For example, it may be useful to look at the current month's trendline set in the context of the previous 12 months. The Data for bands must be checked, and the appropriate range of data must be selected. This is on a row-by-row basis. For example, the range chosen for the banding must have the same number of rows as the range for the trendline. The bands vary from row to row.
- Use custom percentile boundaries
Rather than using quartiles, it's possible to define custom percentile bands. This approach still requires one row of incoming data, specifying 5 ascending percentage values (typically starting with 0% and ending with 100%).
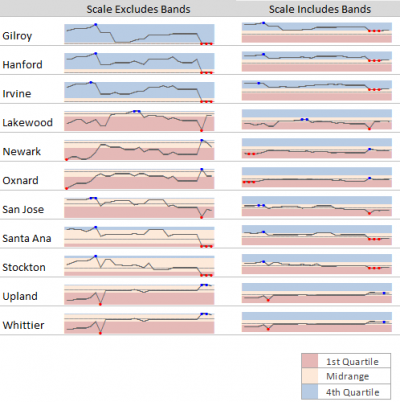
- Include Band data in Scale
There'll be higher and lower values in the data set used to calculate the bands than in most individual rows being plotted. The dialogs enable you to choose whether or not to include the defined bands in the scale. Including the banding data will make the trendline flatten. It may be worth including if the overall values being plotted are very close. However, where there's a significant variance, generally don't include it and rely on the color banding to display this information.
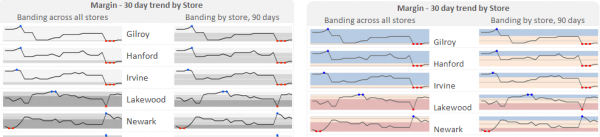
The example below shows the possible difference in this approach. The sparkline itself shows the last 30 days' volumes, and the bands are based on the last 90 days. Where the bands are included in the scale, the trendlines are much flatter, and everything is on a consistent scale. With bandlines removed from the scale, individual trends are more obvious. You can still see where the values fall in the overall spread by looking at the background color of the quartile the values are in.