Treemaps show the relationship between two measures, and their variance across a dimension.
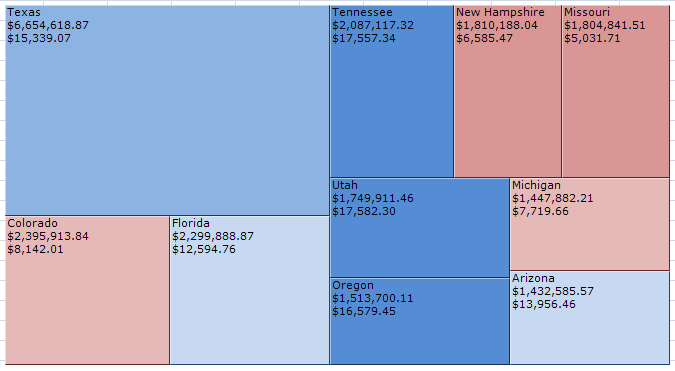
The treemap plots sales against profit across the top ten states in the USA. In this example, the size of the area represents the total sales, and the color shows how profitable the sales in that area were.
In Anaplan XL Reporting, you can source treemaps from a Table, Excel range or from a cube.
Data sources
Table or Excel range
The data sources for tables and Excel ranges are quite similar.
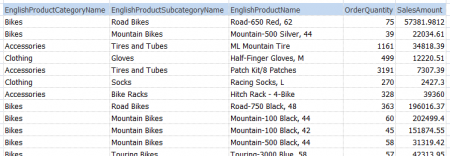
In both cases, you select multiple columns. Anaplan XL uses the last two columns as the size and color values to plot, and the other columns provide the member values.
You can have several member columns, in which Anaplan XL enable drill-down into the data.
Example
If you start with this data in Excel:
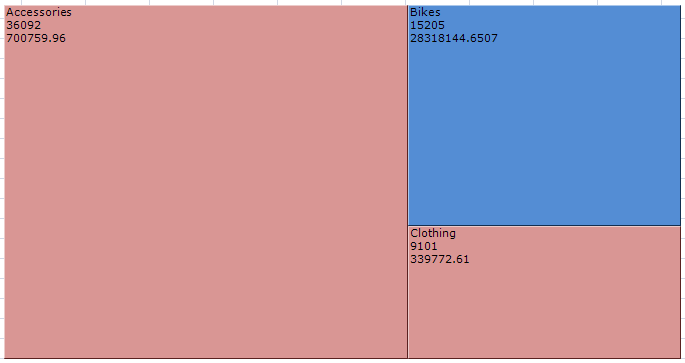
You can create this treemap, which starts at the top level:
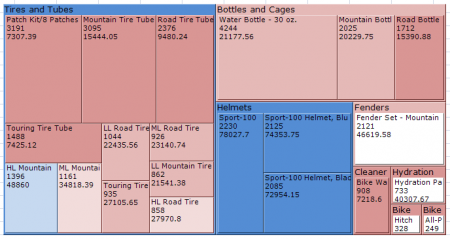
You can drill into the areas by double-clicking to get more detail.
Data options
If you edit the treemap, you get options to customize its behavior.
The Show second level option allows you to instantly see the make up of each outer area from its children. For example, in the above example we see the product category, and how each sub-category contributes to it. Drill and we can see the products in a sub-category:
The Total Size using and Total Colour using options enable you to choose how the data is aggregated. By default, a parent's number is made up of the sum of its children, but you can use other methods. For example, total a percentage using the average of the children.
Finally, you can use the number format text boxes to set the number format used on the treemap. By default, data sourced from an Excel range will use the number format set in Excel.
Cube
When sourcing a treemap from a cube, you get the usual member selector found throughout Anaplan XL.
You must put a hierarchy in the Plot area, and this defines the areas to be plotted.
The Header area performs the action of slicing the results. For example, showing only data for a given time period.
The Behaviour tab enables you to control the data displayed.
The Values section allows you to pick the measures used for the size and colour of the treemap. Although measures is the default hierarchy, you can drop in a different one if you need to. You can also select the number formats for the values, although these are overridden by the Apply Cube formatting option, if that is selected.
The Split by section allows you to define a two-level treemap. The second level can be a lower level of the hierarchy you chose to plot, or it could be a different hierarchy entirely.
Common Options
- Gradient: choose the color scheme for the treemap. You can reverse the color order in cases where low numbers are good, for example, losses.
- Layout: you can change the method by which the areas are laid out.
- Order by size — larger areas come first.
- Natural order — attempts to keep the areas in the order they started in. This is the order they are found in tables and ranges, cube order when the data source is a cube.
- Squares — attempts to make the areas as square as possible, makes comparing sizes easier.
- Parent name position: choose the title position when showing two levels in the treemap.
- Output range: area to output the clicked area name. Allows you to drive another section of the report from the treemap. If you have nested areas, then you can pick a range of several cells to contain the names at each level.
- Link to: use in conjunction with Output range, allows you to jump to the section of the report updated when the treemap was selected.
- Show back/forward controls: show the arrows used to navigate when drilling.
Formatting
Specify the layout and formatting of the treemap text by using the Text setting when inserting a Treemap. These can be formatted using Custom number formats.
You can specify %sizemeasure% and %colormeasure%.
You can specify the font style and color in the format sheet.
To do this, set the Item Name for either the name of the Treemap (specified in the options form) or Treemaps to apply to all treemaps.
The Hierarchy and Member columns must contain *, and the format is taken from the data format cell in the row.
Additional data
You can add extra data fields from a SQL or Excel source by referencing the column in the text.
The reference should be %fieldName% or %valueN%, where:
- fieldName is the field returned in SQL, or the column letter in Excel.
- valueN should use a number as N, where 1 is size, 2 is color, and 3 upwards are additional ata fields in the data.

