It allows you to format any SparkBox In-Cell chart in your report. For details about how to invoke the dialog, see In-Cell Chart Designer.
Chart Options
There are various options in the chart that you can use:
- Length: The horizontal scale factor to use when drawing the chart.
- Use custom percentile boundaries: A set of values to define the percentile boundaries for the box plot, these are:
- The sample minimum (smallest observation).
- The lower quartile, or first quartile.
- The median (middle value).
- The upper quartile, or third quartile.
- The sample maximum (largest observation).
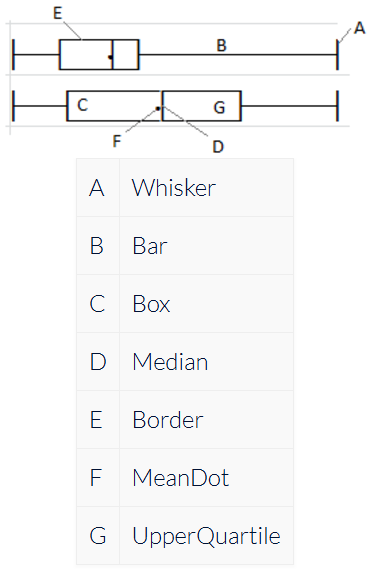
- Box Plot Anatomy: Color. The diagram below shows the anatomy of the XL3SparkBox diagram. The letters refer to the names of the color-selecting boxes in the SparkBox In-Cell Chart dialog.
- Additional Values: In the current version, you can also plot additional values on the box plot. This could be the same values used in the box plot to help see the distribution. You could also use another set of values to compare the distribution.
Axis Options
There are various options on the chart axis that you can use:
| Axis options | Description |
| Customize axis | Allows you to choose further options defining how the formula cell (for In-Cell Chart formulas), or the member name (when used in Grids) is rendered. |
| Use title only | Uses the given text as a caption. |
| Axis with tickmarks above | Draws a horizontal axis, with tickmarks and optional labels above the axis. |
| Axis with tickmarks below | Draws a horizontal axis, with tickmarks and optional labels below the axis. |
| Custom tickmark frequency | Overrides the automatic calculation of major tickmarks. |
| Minor ticks per major tick | Adds the given number of minor (labelless) tickmarks between each major tickmark. |
| Show labels on major ticks | Specifies whether numeric labels should be rendered for the axis. |
| Number format | The format string to be used for the axis labels. |
| Custom axis minimum | A value to use for the minimum horizontal axis value. |
| Custom axis maximum | A value to use for the maximum horizontal axis value. |

