For some features, Anaplan XL allows you to select a color gradient to visualize a particular data set:
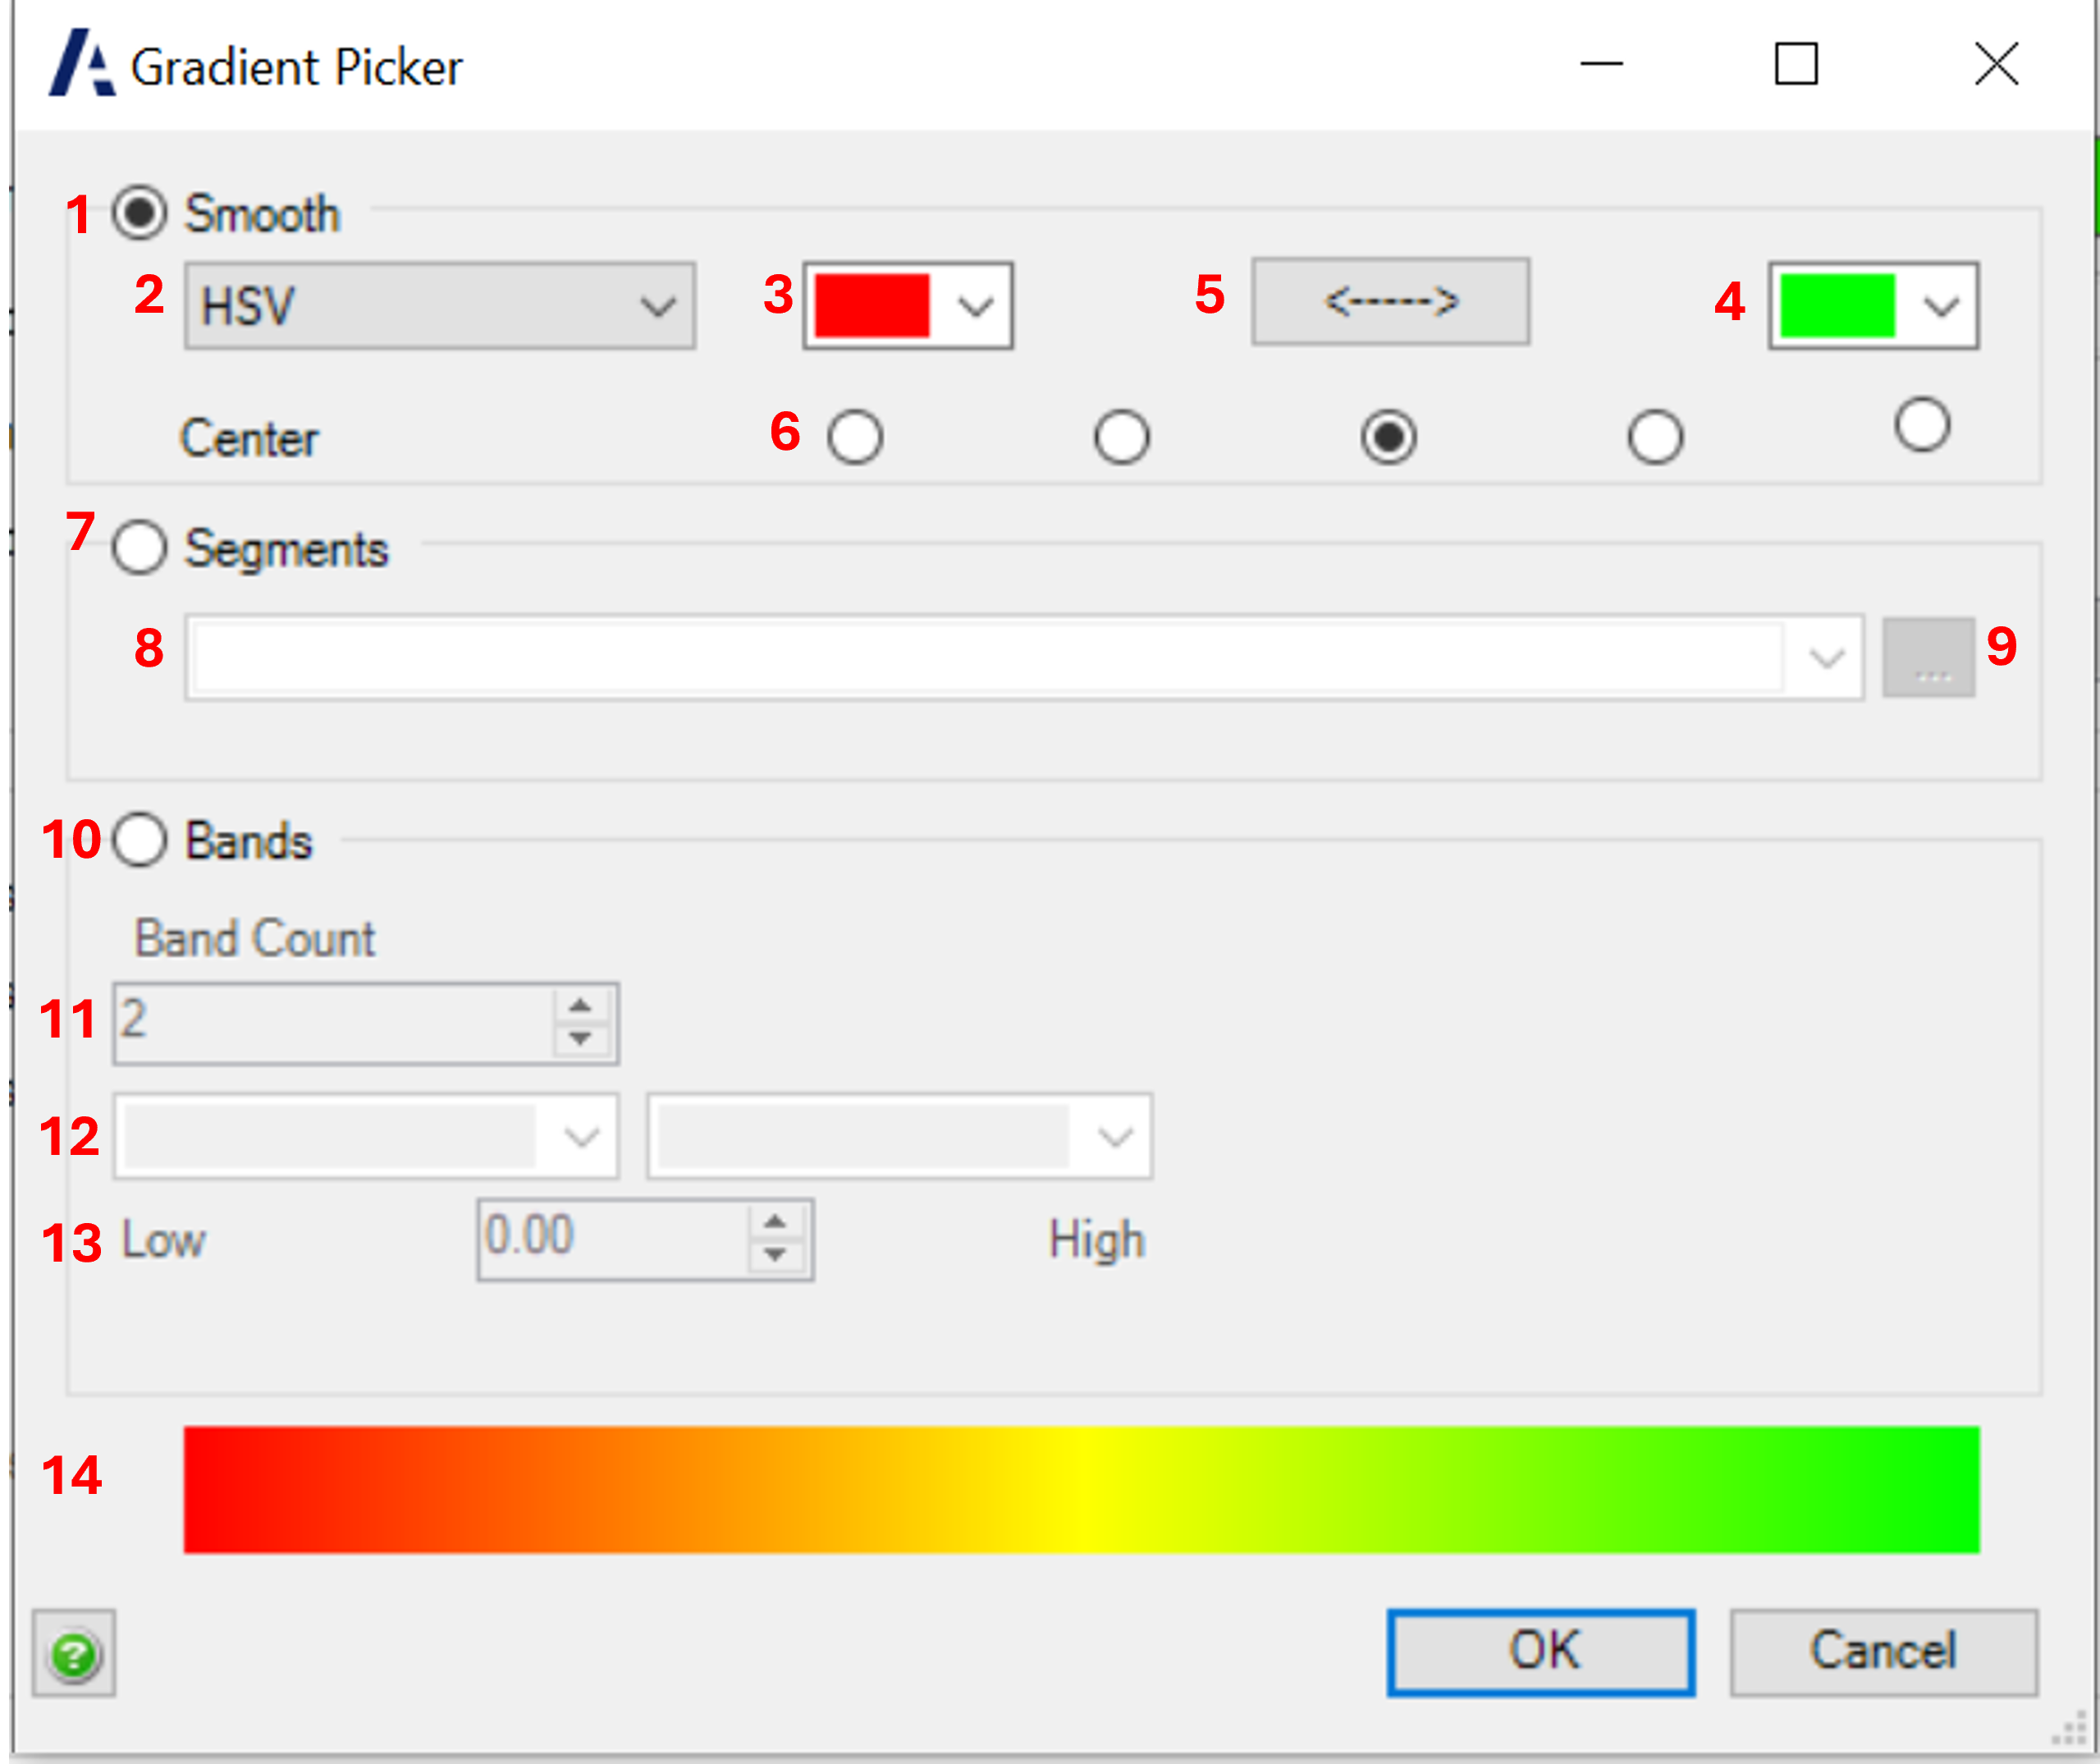
The Gradient Picker window enables you to pick the options for designing the gradient for your report:
- Selects a smooth gradient between the selected endpoints
- The color model to use:
- HSV (hue, saturation and value)
- RGB (red, green and blue)
- The start color for the gradient.
- The end color for the gradient.
- Reverse the gradient. Swaps the start and end colors.
- Moves the center of the gradient. This affects how much the data range is assigned to which color.
- Selects a gradient split into blocks of color instead of a smooth transition.
- Several pre-configured segment patterns.
- Edit the currently selected segment pattern.
- Select bands of color for the gradient.
- Determines the number of bands.
- Select the colors for each band.
- Sets the Low and High for the bands.
- Shows a preview of the finished gradient.

