Use the SparkIcon Chart Designer to format any SparkIcon In-Cell Charts in your report.
These charts have two ways of being used:
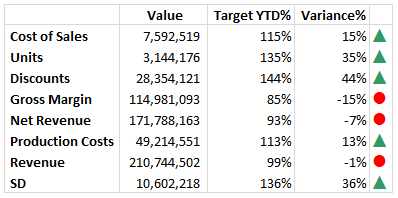
- Single data source: the colour and icon type are driven from the same data, giving two ways to see the same information
- Dual data sources: the colour and icon type have independent data sources, giving the opportunity to increase data density of your reports
For details about how to invoke the dialog, see In-Cell Chart Designer.

