This dialog is used to format any SparkPie In-Cell Charts in your report.
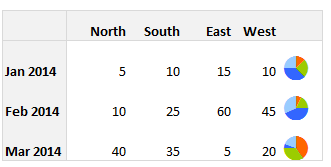
Chart Options
Title
- Specifies a title to place in the formula cell (for In-Cell Chart formulas), or to use as the member name (when used in Grids)
Colours 1 to 8
- Specify the colors used for the pie sectors
For details about how to invoke the dialog, see In-Cell Chart Designer.

