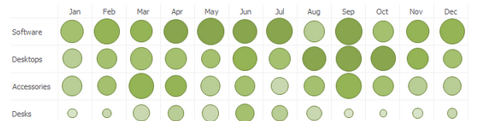
The dialog is used to format any SparkHeatMap In-Cell Charts in your report.
| Option | Description |
| Title | It specifies a title to place in the formula cell for In-Cell Chart formulas or as the member name when used in Grids. |
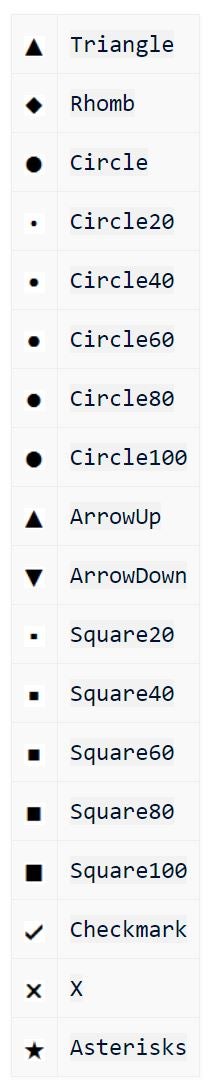
| Icon | The icon type to use in the output. |
| Low colour | The color to use for the minimum value |
| Mid-range colour | The color to use for the mid-range value. It can be disabled to create a smooth range from low to high. |
| High colour | The color to use for the maximum value |
| Steps | The number of different color bands |
| Minimum | A value to use as the minimum. The value is taken from the data if no value is specified… |
| Maximum | A value to use as the maximum. The value is taken from the data if no value is specified |
Icon Sets
Icon types are available for use with In-Cell Charts.
For details about how to invoke the dialog, review In-Cell Chart Designer.

