Creates an indicator icon that is rendered in an Excel cell.
Double-clicking the chart, or selecting the Anaplan XL > Format In-Cell Chart... right-click menu item enables the editing of the chart format using the SparkIcon Chart Designer.
Syntax
XL3SparkIcon( Data, Output, InRows, [IconSet], [Operators], [RangeCount], [Border1], [Border2], [Border3], [Border4], [Colour1], [Colour2], [Colour3], [Colour4], [Colour5], [RangeOrder], [AltData], [AltOperators], [AltRangeCount], [AltBorder1], [AltBorder2], [AltBorder3], [AltBorder4], [AltRangeOrder], [Label] )
Parameters
| Parameter | Description |
| Data | The data to chart. This can be a range or a formula. |
| Output | The target range in which to render the chart(s). |
| InRows | Specifies whether the input data are in rows or columns:
|
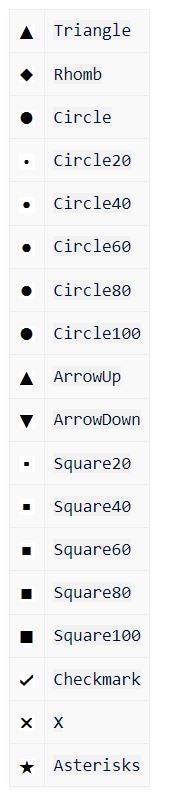
| IconSet | A pipe (|) delimited list of icons to use. The possible icons are listed below. |
| Operators | A pipe (|) delimited list operators to use. The possible values are > and >=. |
| RangeCount | The number of icons ranges to use. |
| Border1 | The value above which the first icon should be used. |
| Border2 | The value above which the second icon should be used. |
| Border3 | The value above which the third icon should be used. |
| Border4 | The value above which the fourth icon should be used. Values below this value will use the last icon. |
| Colour1 | The color for the first range. |
| Colour2 | The color for the second range. |
| Colour3 | The color for the third range. |
| Colour4 | The color for the fourth range. |
| Colour5 | The color for the fifth range. |
| RangeOrder | -1 to reverse the icon order. |
| AltData | If specified, it causes the colors to be driven from this instead of the Data parameter. This can be a range or a formula. |
| AltOperators | If AltData is specified, a pipe (|) delimited list operators to use for the color ranges. |
| AltRangeCount | If AltData is specified, the number of color ranges to use. |
| AltBorder1 | If AltData is specified, the value above which the first color should be used. |
| AltBorder2 | If AltData is specified, the value above which the second color should be used. |
| AltBorder3 | If AltData is specified, the value above which the third color should be used. |
| AltBorder4 | If AltData is specified, the value above which the fourth color should be used. |
| AltRangeOrder | If AltData is specified, -1 to reverse the color order. |
| Label | Specifies the text to use in the formula cell. |
Icon Sets
Use icons with In-Cell Charts.