Worksheets display detailed data from Anaplan models on an interactive grid and on related cards.
Use worksheets to:
- analyze and edit data; and
- perform actions, such as imports and exports.
When a page builder creates a worksheet, they select a module view that provides you with the most relevant data for planning and analysis.
The central element of a worksheet is a grid.
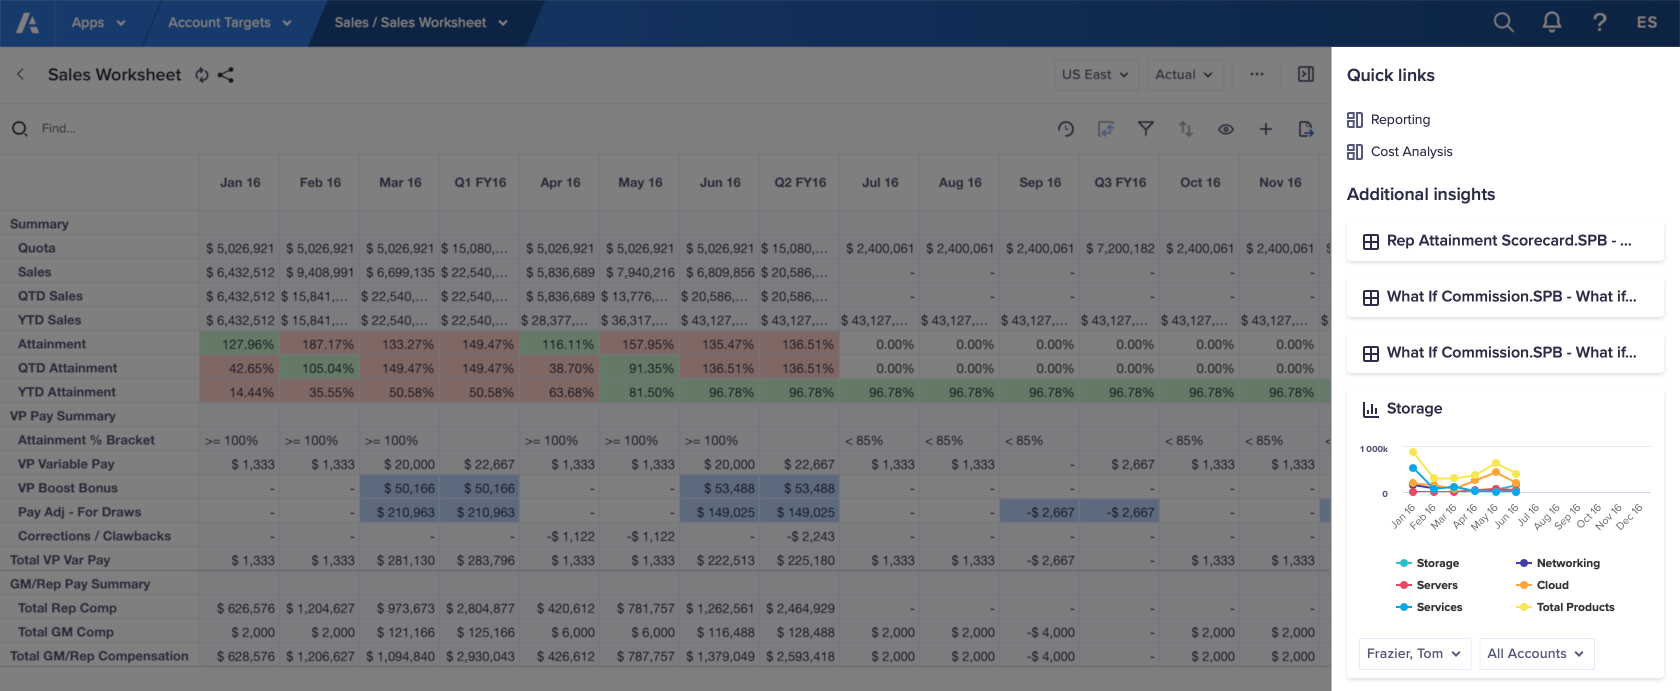
Insights panel
Use the Insights panel to display related data and the impact of changes.
Add editable grids or fields at the top of the Insights panel for changing drivers and assumptions.
Links to related pages display in the Quick links section of the Insights panel. This means that you can open related pages without navigating to another app.
Cards are interactive components that display contextual data. They appear in both the Insights panel and the Additional insights section.
Learn how to use worksheets:

