Grids are interactive components for displaying data from Anaplan models.
Grids on boards
On a board, data is displayed in a grid card. A user can enter data in a grid card if you enable this permission.
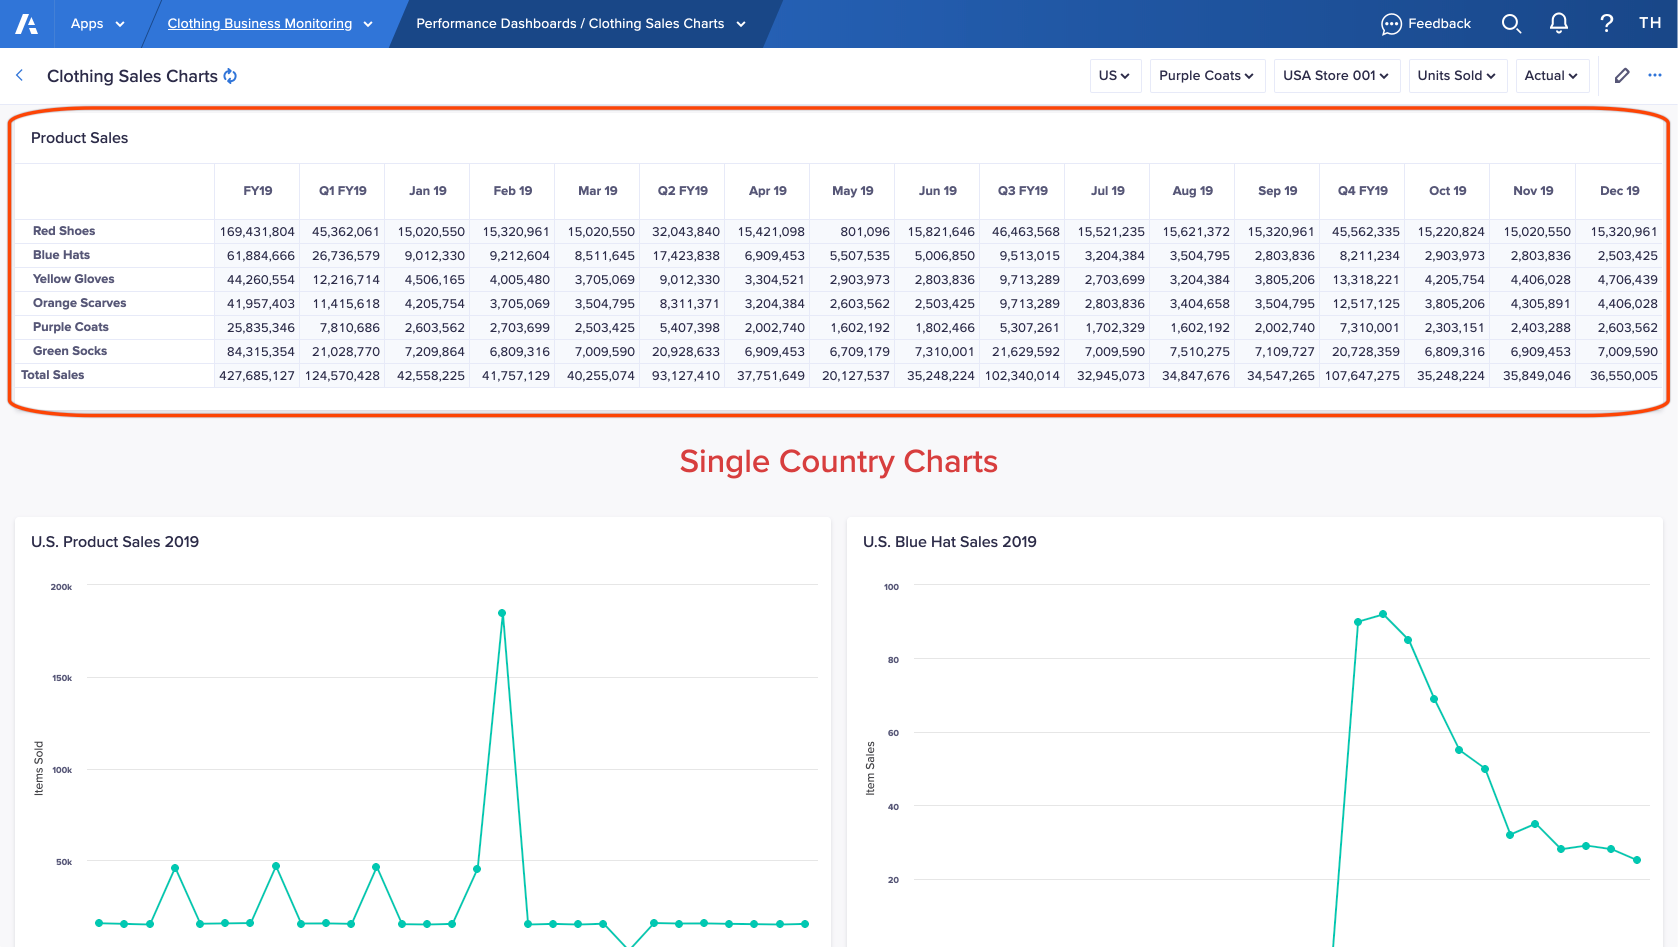
Grids on worksheets
In a worksheet, the main grid displays in the center of the page, and grid cards display in the Insights panel. A user can enter data in a grid if you enable this permission.
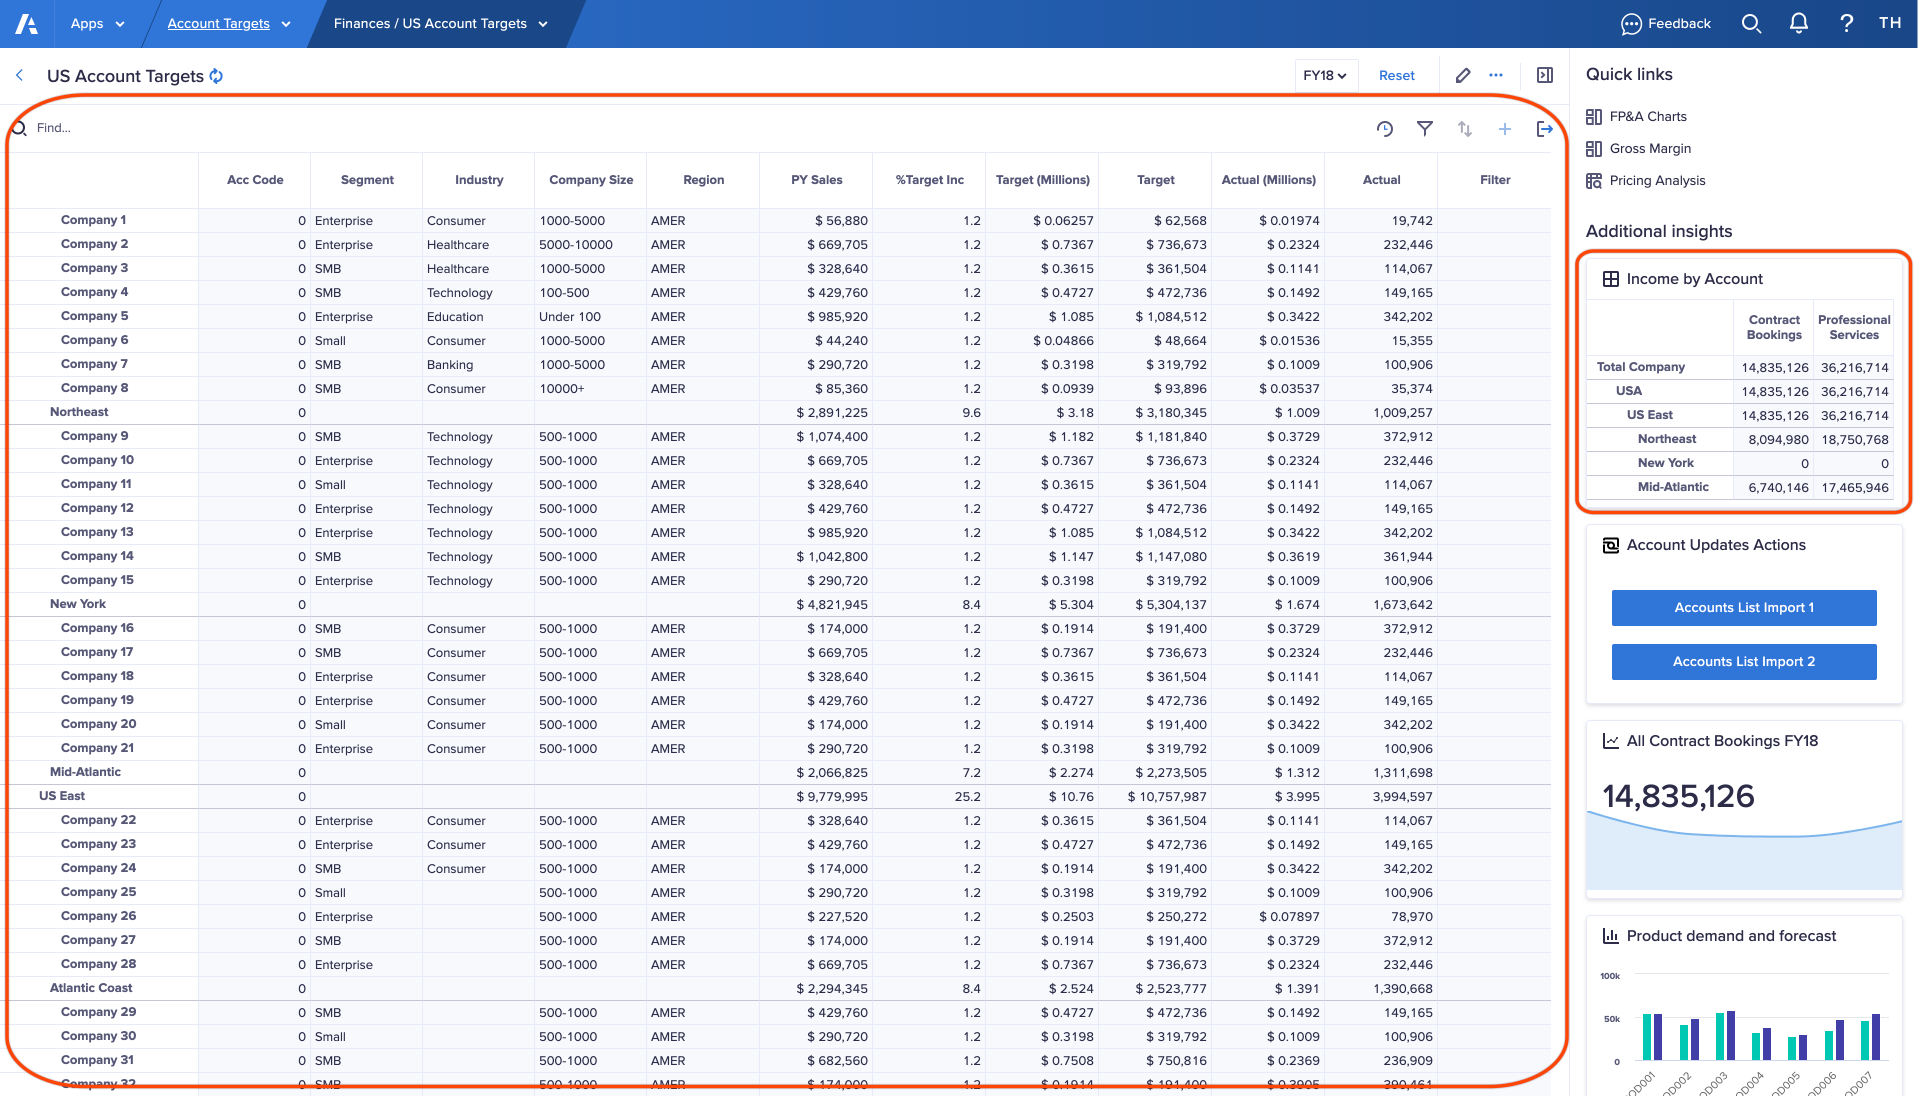
Discover
Search for dimensions and data items within a worksheet grid, and then select them as context.
Quick links take you to related pages.
You can drill down into any cell that contains a formula or summary, to see how the cell's value is calculated. You can open and resize the insights panel, if your page builder prepared it.
When you select data in a grid, Count, Min, Max, Average, and Sum calculations display in the Quick sum bar at the bottom of the screen.
Use cell history to view changes to all data in a grid, or for specified of cells, over a time period.
Edit values
Editable cells contain purple text on a white background. Read-only cells contain dark gray text on a light gray background.
For editable cells, you can:
- Edit link-formatted and email-formatted cells in the grid.
- Paste into any cell that you can type into.
You can also copy a selection across or down all cells to the edge of the grid. - Change a selection of checkboxes from checked to unchecked, or vice versa.
- If allowed by your page builder, add or remove list items.
- Undo a cell change.
Select and arrange
To change what data you see, you can:
- Use the context selectors to change the dimension displayed on a grid in a board or worksheet.
- Pivot the grid to change which lists and line items are columns and rows.
- Select items to show on a worksheet.
- Filter the data in a grid on a worksheet with criteria.
- Sort a grid so that the data displays in ascending or descending order.
Format
To change how data displays on a grid, you can resize column width, format cells, and set conditional formatting to highlight data.
Run actions
You can export data from a current view and run an action from the worksheet toolbar.

