In a module or dashboard grid, use the Quick sum bar to display simple calculations.
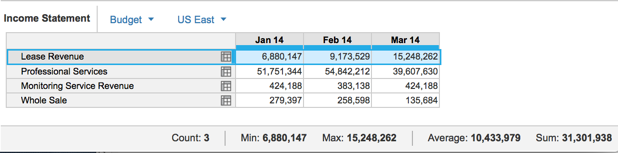
The Quick sum bar appears in the bottom-right corner, when multiple data cells are selected. The calculations displayed are:
- Count, the number of cells selected.
- Min, the lowest value selected.
- Max, the highest value selected.
- Average, the average of all the values selected.
- Sum, the total of all values selected.
Your data selection can be a:
- Continuous range of cells.
- Column or row of data.
- Nested selection.
The Quick sum bar:
- Only performs calculations on number formatted cells, except for the Average calculation, which includes the values of all the cells selected regardless of format.
- Excludes cells that are blank.
- Follows the format of the first line item selected. For instance, if the first cell you select is formatted in dollars, then the calculations displays in dollars.
- Doesn't exclude summary values if they're selected in a range of cells. It's good practice to hide summary rows or columns before you select any cells.
- Won't display the value of the calculation if it exceeds 9007199254740991 or -9007199254740991.
- Uses values accessible in memory. If the data required to complete the calculation isn't available in memory, there's insufficient data available to complete the calculation.
The Quick sum bar is shown by default. To hide it, navigate to the Question Mark in the top-right corner of the global navigation bar, and select Hide quick sum bar from the dropdown menu.

