Breakback lets you type a value into a total (aggregate) cell, and all the cell values that make up the total are changed to reflect the total value. For example, you can distribute a total annual salary over 12 months to calculate a monthly payment. Breakback is indicated by a blue triangle in the top-left corner of the cell.
You can use Breakback to allocate data using seasonality patterns. For example, you could specify a profile based on expected sales throughout a year, then enable Breakback. When you type a value into the total, data is allocated across the cells pro-rata.
Enable Breakback in Modules in the model settings bar, or in the module's Blueprint.
This example contains seasonality data loaded into a grid, with Breakback enabled for the Gross Sales line item.
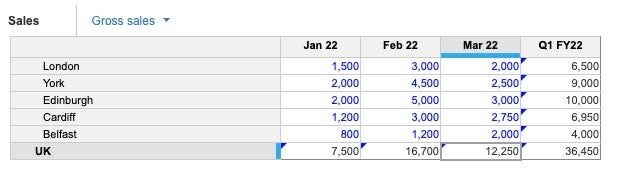
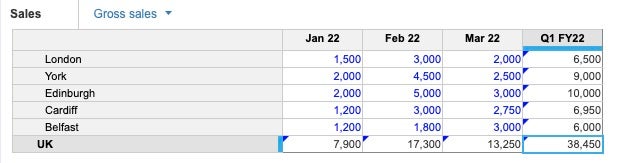
If you change the Q1 FY2022 total for Belfast to 6,000, breakback is triggered. Data is allocated across the months and regions pro rata based on the original values. The UK figures are also updated to reflect this.
Breakback works across multiple dimensions. For example, if you change the Q1 FY22 total for the UK, breakback uses the seasonality pattern to allocate across months, and the geographical split to allocate across the cities.
Note: If a Breakback change to a lower-level item in a list hierarchy affects cell data for a higher-level item, the change only displays in the cell history for the lower-level item.
If the sum of the cells in a grid is zero, typing a value into a total allocates the amount evenly across the leaf-level cells. In this example, 12,000 is typed into Q1 FY22 and is allocated evenly across the three months.
| Jan 22 | Feb 22 | Mar 22 | Q1 FY22 | |
| Germany | 4,000 | 4,000 | 4,000 | 12,000 |
You can copy and paste into several Breakback-enabled totals at once. All child cells affected by each Breakback total are updated accordingly for the change in total values.
Total cells that have Breakback enabled have a blue triangle in the top-left corner. Hover over the Breakback marker to see how many cells are impacted by Breakback. You can hide the Breakback markers in the Help menu. Select Hide breakback markers.
Breakback can affect many cells. Because of this, the change history for a module only shows the cell change that originally triggered the Breakback, together with the total number of affected cells.
Hold
Hold is a Breakback feature that allows you to temporarily 'hold' values in cells. Use Hold to update totals without impacting a value for a line item, or to change values for a particular line item without changing the overall total.
Read-only cells
Read-only cells are held at their previous values when Breakback is triggered. The cells could be read-only because of Selective Access settings, or because of Dynamic Cell Access settings. Cells can also be read-only in a rolling forecast, where early months contain historical data that can't be changed.
Restrictions
Nonzero cells, which total zeros
Breakback doesn't work in all cases. For example, if you have leaf-level cells that don't contain zeros that sum up to a zero total, as shown in this example, an error is displayed.
| Jan 22 | Feb 22 | Mar 22 | Q1 FY22 | |
| Berlin | -1,178 | 589 | 589 | 0 |
Breakback across line items
Breakback isn't permitted across several line items. It's restricted to totals on simple hierarchies and totals on the time dimension.
Polaris cell count limit
If the use of Breakback affects more than 1,000,000 cells, then the system displays a warning message.

